
Agriculture is a high-stakes business. A single miscalculated planting decision or an unforeseen weather event can wipe out an entire season’s revenue. According to the FAO, extreme weather disasters cost the global agriculture sector an estimated $123 billion annually, equaling roughly 5% of global agricultural GDP. That is a staggering number, and it is growing every year.
This is precisely where crop yield prediction using machine learning enters the picture. Instead of relying on gut instincts and outdated almanacs, modern agribusinesses are using AI to forecast yields with data-driven precision. As result, turning unpredictable climates into manageable variables and protecting farm profitability from season to season.
Introduction to the Future of Farming
Crop yield prediction is the science of estimating how much a given field will produce before the harvest actually happens. Traditionally, it meant looking at last year’s numbers, checking the almanac, and hoping for the best.
Today, that approach is obsolete. AI crop yield prediction leverages satellite imagery, weather APIs, soil sensors, and decades of historical data to build dynamic forecasting models. These models do not just guess; they learn and adapt with every new data point, setting the very base of smart farming. The result is a shift from reactive decision-making to proactive, data-driven foresight that keeps your operation ahead of the curve.
The global AI in agriculture market reflects this momentum. It is projected to grow from $2.8 billion in 2025 to $8.5 billion by 2030, expanding at a 25.1% CAGR. For farm operators and agribusiness leaders, the message is clear: the future of farming is intelligent, and it is arriving fast.
What Is Crop Yield Prediction & Why Is It Critical?
At its core, crop yield prediction is the process of using historical, environmental, and operational data to estimate the volume of produce a field will generate in a given growing season. But its real value goes far beyond a simple tonnage number.
When you have a reliable yield forecast weeks or months before harvest, every downstream decision becomes sharper. Here is how accurate prediction directly affects the business side of your operation:
- Supply Chain Logistics: Knowing expected volumes lets you secure transportation contracts, negotiate storage rates, and coordinate with distributors early, avoiding last-minute scrambles that drive up costs.
- Labor Scheduling: A reliable yield estimate helps you hire the right number of seasonal workers at the right time. Overstaffing drains margins; understaffing means crops rot in the field.
- Storage and Inventory Planning: If you predict a bumper crop and your grain bins are at capacity, you need to arrange overflow storage before prices spike. Conversely, overestimating yield ties up capital in unused capacity.
- Financial Hedging and Contracts: Forward contracts, crop insurance, and commodity futures all depend on production estimates. Accurate crop yield prediction lets you lock in favorable terms and hedge against downside risk with confidence.
- Sustainability and Compliance: Regulators and buyers increasingly require proof of responsible resource use. When you know your expected output, you can optimize water, fertilizer, and pesticide applications per acre, meeting both profitability and sustainability targets.
Traditional vs. AI-Driven Crop Yield Prediction Techniques
For decades, farmers relied on traditional crop yield prediction techniques that, while practical, came with serious limitations:
- Historical Averages: Looking at the last five to ten years of yield data and assuming the next season will follow suit. It ignores changing climate patterns and evolving soil conditions.
- Manual Scouting: Walking fields with a clipboard, counting ears per row, and extrapolating. It is labor-intensive, subjective, and only captures a snapshot of field variability.
- Basic Linear Regression: Plotting rainfall against yield on a graph and drawing a line. Simple, but it cannot account for the complex, nonlinear relationships between dozens of interacting variables.
These methods typically max out at around 60–70% prediction accuracy, leaving a significant margin of error that translates directly into financial risk.
AI-driven crop yield prediction takes a fundamentally different approach. Machine learning models ingest data from hundreds of variables simultaneously, including weather, soil chemistry, satellite imagery, and even pest pressure indices. They identify patterns no human could spot manually, and they improve with every season of new data. Key advantages include:
- Multi-Variable Analysis: AI models weigh temperature, precipitation, humidity, solar radiation, and soil nutrients in combination rather than isolation.
- Real-Time Adaptation: Unlike static models, ML algorithms update predictions as new data arrives mid-season.
- Scalability: Whether you manage 500 acres or 50,000, the same model architecture scales without proportional increases in manual effort.
Research consistently shows that well-tuned ML models achieve 85–95% accuracy in crop yield estimation. It is a dramatic improvement over traditional methods that can mean millions of dollars in better-informed decisions across a large operation.
Essential Data Sources and the Ideal Crop Yield Prediction Dataset
You can have the most sophisticated algorithm in the world, but if you feed it incomplete or noisy data, your AI crop yield prediction will underperform. Understanding what data to collect and where to source it is the critical first step in building a reliable forecasting pipeline.
Climate and Weather Data
Weather is the single largest variable affecting crop outcomes. Your crop yield prediction dataset must include granular records of temperature (daily highs, lows, and averages), precipitation (amount, frequency, and intensity), solar radiation, humidity, and wind speed.
Historical weather archives provide the training foundation, while real-time weather API feeds keep predictions current throughout the growing season. Services like NOAA’s Climate Data Online and private providers offer station-level data that can be mapped directly to your fields.
Remote Sensing & Satellite Imagery
Satellites provide a bird’s-eye view of crop health that no amount of ground scouting can replicate. The key indices include:
- NDVI (Normalized Difference Vegetation Index): Measures the difference between near-infrared light (which vegetation reflects) and red light (which it absorbs). Higher NDVI values indicate denser, healthier crop canopies.
- EVI (Enhanced Vegetation Index): An improvement on NDVI that corrects for atmospheric conditions and soil background noise, making it more reliable in areas with dense vegetation.
- NDRE (Normalized Difference Red Edge): Particularly sensitive to chlorophyll content in leaves, making it useful for detecting nitrogen stress and crop maturity stages.
These indices, sourced from platforms like the European Space Agency’s Sentinel-2 program, feed directly into ML models as numerical features that quantify crop vigor at scale.
Soil and IoT Sensor Data
Above-ground imagery tells only half the story. Below the surface, deployed across your fields, continuously monitor soil moisture levels, pH, electrical conductivity, and nutrient concentrations (nitrogen, phosphorus, potassium).
This data helps models understand the growing environment at the root zone level, capturing variability that satellite imagery alone cannot detect. When combined with historical yield maps, soil data enables zone-level predictions within individual fields.
Open-Source vs. Proprietary Datasets for Crop Yield Prediction
| Open-Source Datasets | Proprietary Datasets |
| FAOSTAT – Global production and yield data by country, crop, and year | Farm-specific IoT sensor logs (soil moisture, nutrients, microclimate) |
| Kaggle Crop Yield Datasets – Community-curated datasets for model benchmarking | Historical yield records from internal farm management systems |
| Sentinel-2 Satellite Data – Free multispectral imagery for NDVI, EVI, NDRE | Drone-captured high-resolution imagery (RGB, multispectral, thermal) |
| NOAA Climate Data Online – Historical and real-time weather station records | Proprietary weather micro-stations deployed on-farm |
| NASA POWER – Solar radiation and meteorological data for agroclimatology | Precision application records (fertilizer, pesticide rates by zone) |
The most effective crop yield prediction systems combine both categories, using open-source datasets for broad training and proprietary data for farm-specific calibration.
Top Machine Learning Models for Crop Yield Prediction
This is where the science meets the field. The machine learning models for crop yield prediction used in production-grade systems are not one-size-fits-all. Different algorithms excel with different data types, field sizes, and complexity levels. Below is a breakdown of the three primary model families that dominate the AgTech landscape.
Tree-Based Frameworks: Random Forest & XGBoost
Tree-based models are the workhorses of applied crop yield prediction machine learning. They are popular because they handle the messy, heterogeneous data that characterizes agricultural datasets exceptionally well.
Random Forest builds hundreds of individual decision trees, each trained on a slightly different random subset of your data, and then averages their predictions. This “ensemble” approach makes the final forecast far more stable than any single tree would produce on its own. It naturally resists overfitting, which is critical when your training data includes noisy variables like daily temperature swings alongside stable ones like soil type.
Key strengths of Random Forest for agriculture include:
- Feature Importance Ranking: The model tells you which variables (rainfall, GDU accumulation, soil pH) contributed most to the prediction, giving agronomists actionable insights beyond just a yield number.
- Tolerance for Missing Data: Farm datasets are rarely complete. Random Forest handles gaps without requiring complex imputation.
- No Need for Feature Scaling: Unlike neural networks, tree-based models do not require you to normalize your input data, simplifying the preprocessing pipeline.
XGBoost (Extreme Gradient Boosting) takes a different ensemble approach. Instead of building trees in parallel, it builds them sequentially, with each new tree specifically correcting the errors of the previous one. This iterative refinement makes XGBoost exceptionally accurate on tabular agricultural data.
Artificial Neural Networks (ANNs) & Deep Learning
When your data includes images, time-series sequences, or complex spatial relationships, deep learning architectures step in where tree-based models reach their limits.
Convolutional Neural Networks (CNNs) are the go-to architecture for processing satellite and drone imagery. They automatically learn to extract visual features, including canopy density, color variations indicating stress, and spatial patterns of disease spread, from raw pixel data. Instead of manually calculating NDVI from imagery and feeding it into a model, a CNN learns to extract these vegetation health indicators directly, often discovering patterns that predefined indices miss.
For your field-level crop health monitoring, CNNs can process multispectral imagery to identify yield-limiting stress zones well before they are visible to the naked eye.
Long Short-Term Memory Networks (LSTMs) are specialized neural networks designed for sequential, time-dependent data. In agriculture, their primary application is modeling weather patterns over a growing season. Unlike standard models that treat each day’s weather independently, LSTMs remember what happened last week, last month, and even earlier in the season, capturing the cumulative impact of a prolonged dry spell followed by sudden rainfall on crop development stages.
LSTMs are particularly effective for crops with long growing seasons, such as corn and soybeans, where the sequence of weather events across matters as much as individual weather readings.
Deep Neural Networks (DNNs) with multiple hidden layers offer the flexibility to model highly nonlinear relationships between dozens of input features. They can simultaneously learn from weather data, soil chemistry, management practices, and genetic variety information. However, they require larger training datasets and more computational resources, making them best suited for organizations that have several years of high-quality, multi-field data available.
Support Vector Machines (SVM) & Regression Models
Not every farm has the data volume to justify a deep learning pipeline. For smaller operations or localized prediction tasks, Support Vector Machines and advanced regression techniques remain highly effective crop yield prediction models.
SVMs work by finding the optimal boundary (or hyperplane) that separates different yield outcomes in a multidimensional data space. They excel when:
- Your dataset is relatively small, a few hundred records from a single farm or region.
- The feature set is limited but well-curated, for example, just soil nutrient levels and seasonal rainfall for a single crop).
- You need a model that generalizes well to new, unseen data without requiring extensive hyperparameter tuning.
Regression-based approaches, particularly Ridge and Lasso regression, add regularization terms that prevent the model from overweighting any single variable. These methods are computationally inexpensive, easy to interpret, and serve as strong baselines against which more complex models should always be benchmarked.
A practical strategy many AgTech teams follow is to start with an SVM or regularized regression baseline, quantify accuracy. After that, they invest in deep learning only if the business case justifies the additional complexity and data infrastructure.
Evaluating Model Accuracy: How Do We Know It Works?
Building a machine learning crop yield prediction model is one thing. Trusting it enough to base planting, purchasing, and financial decisions on it is another. That trust comes from rigorous evaluation using standard accuracy metrics. Here are the three numbers every farm data team should track:
RMSE (Root Mean Square Error) measures the average magnitude of prediction errors, with larger errors penalized more heavily. If your model has an RMSE of 0.5 tons per hectare, it means predictions typically deviate from actual yields by about half a ton. Because RMSE amplifies big misses, it is the best metric for catching catastrophic outlier predictions that could lead to costly planning errors.
MAE (Mean Absolute Error) calculates the average of all prediction errors without penalizing large misses disproportionately. It gives you a straightforward, easy-to-communicate measure of typical forecast accuracy. If your MAE is 0.3 tons per hectare, stakeholders immediately understand that the model is usually off by about a third of a ton.
R² Score (Coefficient of Determination) expresses how much of the yield variability your model explains, on a scale from 0 to 1. An R² of 0.90 means the model captures 90% of the factors driving yield differences across fields and seasons. For production-grade crop yield prediction systems, an R² above 0.85 is generally considered reliable enough for operational decision-making.
Tracking all three metrics in tandem gives you a complete picture: RMSE catches worst-case scenarios, MAE reports everyday accuracy, and R² confirms the model is learning meaningful patterns rather than just noise.
How Can AI Improve Crop Yield Prediction?
Accurate prediction is just the starting point. The real question for business leaders is: how can AI improve crop yield prediction in ways that translate to measurable financial and environmental results? Here are the key optimization areas:
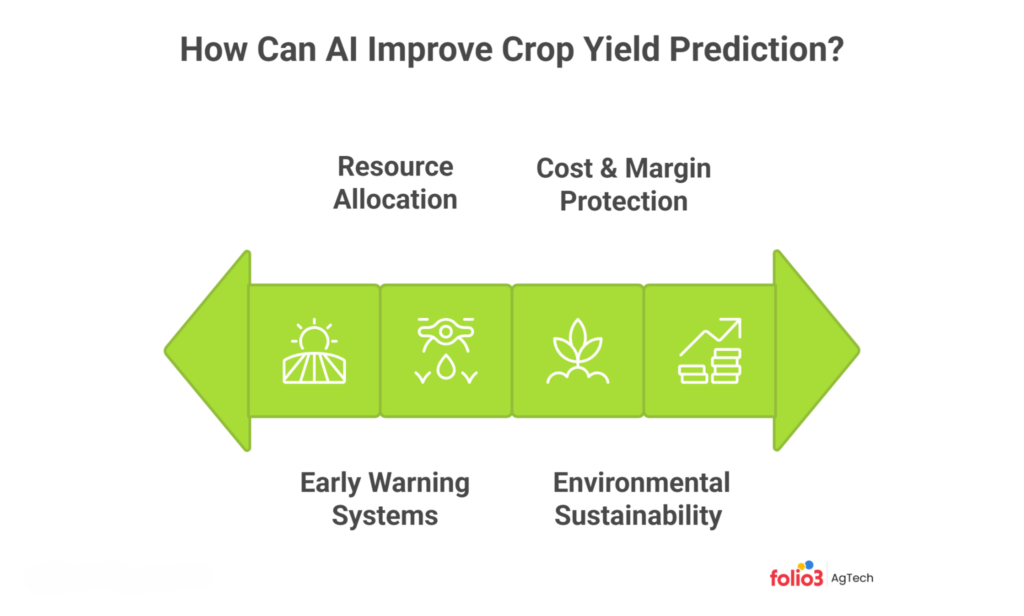
Early Warning Systems for Drought and Disease
AI models continuously analyze weather forecasts, soil moisture trends, and vegetation index changes to flag anomalies before they become crises. A drought warning two weeks before visible crop stress gives you time to activate protocols, adjust nutrient schedules, or trigger crop insurance provisions. The same principle applies to disease detection, where CNNs analyzing drone imagery can identify fungal infections days before they spread to neighboring rows.
Precision Resource Allocation (Variable Rate Application)
When your model predicts zone-level yield potential within a field through Variable Rate Technology (VRT), you can allocate inputs accordingly. High-potential zones receive the inputs needed to maximize returns; low-potential zones receive only what is economically justified. It typically reduces fertilizer and chemical expenditure by 8–20% while maintaining or improving overall yields.
Reduced Environmental Impact and Sustainability
Over-application of fertilizers and pesticides is not just wasteful; it contributes to runoff, groundwater contamination, and regulatory exposure. AI-optimized application reduces these risks, helping you meet sustainability targets and qualify for premium market certifications. With tools that track carbon footprints and water usage, verifiable ESG data becomes a competitive advantage.
Cost-Effectiveness and Margin Protection
Every operational decision, from how many seasonal workers to hire to how much grain storage to lease, becomes more precise when your yield forecast is accurate. It eliminates the padding and guesswork that inflate operating budgets. Research from a 2025 meta-analysis found that precision agriculture technologies deliver an approximate 22.3% increase in ROI across 63 independent studies. So, it is confirming that AI-driven optimization is not theoretical; it is already delivering returns in the field.
Leading Crop Yield Prediction Software for Agribusinesses
The good news for farm managers and agribusiness operators is that you do not need a team of data scientists to benefit from crop yield prediction software. The ecosystem has matured into two distinct tiers: open-source data science tools and enterprise-ready platforms.
Data Science Tools vs. Enterprise Software
For research teams and tech-forward agronomists, Python-based tools like Jupyter Notebooks, Scikit-Learn, TensorFlow, and PyTorch offer maximum flexibility. You can build, train, and evaluate custom crop yield prediction models tailored to your specific crops, geographies, and data sources. However, this path requires significant technical expertise, dedicated infrastructure, and ongoing model maintenance.
On the other hand, enterprise software platforms package these capabilities into user-friendly dashboards with built-in data integrations, automated model updates, and role-based access controls. The trade-off is less customization in exchange for dramatically faster time-to-value and lower total cost of ownership.
Folio3 AgTech Crop Management Software
For agribusinesses looking for a production-ready solution that combines yield forecasting with end-to-end capabilities, Folio3 AgTech offers an AI-powered crop management platform designed by agricultural technology experts. Key capabilities include:
- AI-Powered Yield Forecasting: Leverages historical yield data, real-time weather feeds, and satellite imagery to generate field-level and zone-level production estimates that update dynamically throughout the season.
- Geospatial Analysis and Field Mapping: Integrates multispectral imagery with soil data to create actionable prescription maps for variable-rate application, enabling precision input management across diverse field conditions.
- GDU-Based Crop Scheduling: Automatically calculates Growing Degree Units from the nearest weather station, aligning planting, scouting, and activities with actual crop development stages rather than calendar dates.
- Financial Tracking and Profitability Analysis: Connects yield projections directly to cost-per-acre tracking, input expenditure, and margin analysis, giving you a complete picture of projected profitability by field, crop, and season.
Folio3 AgTech’s platform is designed to integrate with your existing, and ensuring that yield prediction data flows seamlessly into your operational and financial workflows.
Step-by-Step Implementation of AI Crop Yield Prediction in Your Operations
Rolling out crop yield prediction using AI in your operation is a phased process. Here is a practical four-step roadmap:
- Digitize Historical Farm Records: Gather your past five to ten years of yield data, input records, and field maps into a centralized digital system. If your records live in spreadsheets, paper logs, or disconnected software tools, consolidate them first. This historical dataset becomes the foundation your AI model learns from.
- Integrate IoT and Weather APIs: Deploy soil sensors across representative field zones and connect real-time weather data feeds. It ensures your model has current-season inputs to combine with historical patterns. Start small: even a few moisture sensors and a weather API can dramatically improve forecast accuracy over historical averages alone.
- Choose the Right Software Partner: Select a technology provider with deep agriculture domain expertise, not just generic AI capability. A partner like Folio3 AgTech understands the nuances of crop cycles, farm economics, and field-level variability, ensuring that the AI solution fits your operational reality rather than the other way around.
- Train Staff on Acting Upon AI Insights: The best predictive model in the world is useless if your field managers and agronomists do not trust it or know how to act on its recommendations. Invest in practical training that connects model outputs to specific operational decisions: when to irrigate, when to scout, when to adjust input plans, and when to escalate to manual review.
Conclusion
Crop yield prediction powered by AI and machine learning is not about removing the human element from agriculture. It is about arming experienced farm operators with the kind of data-driven foresight that turns uncertainty into a competitive advantage.
The technology is here, the data is accessible, and the ROI is proven. Whether you manage a family operation or a multi-site enterprise, integrating AI into your yield forecasting process is the single highest-leverage investment you can make this growing season.
Ready to see how AI-powered yield prediction fits your operation? Discover how our platform turns your farm data into reliable, actionable yield forecasts, from field to financials.
FAQs
What Crops Benefit Most From AI-Based Yield Prediction?
Row crops like corn, soybeans, wheat, and rice benefit the most because they have large, well-documented historical datasets and standardized growing practices. However, AI models are increasingly being adapted for specialty crops, including fruits, vegetables, and tree nuts, as sensor and imagery data become more accessible.
How Much Historical Data Do You Need To Train A Crop Yield Prediction Model?
Most production-grade models require a minimum of five to seven years of consistent field-level yield data to capture seasonal variability. The more years of data you provide, the better the model can distinguish between normal fluctuations and true yield-limiting events like drought or disease outbreaks.
Can Small Farms Afford AI Crop Yield Prediction?
Yes. Cloud-based SaaS platforms have dramatically lowered the entry barrier. Small farms can access satellite imagery and weather APIs for free or at minimal cost, and enterprise platforms like Folio3 AgTech offer scalable pricing. You do not need expensive on-farm infrastructure to get started.
How Does AI Crop Yield Prediction Handle Extreme Weather Events?
AI models that incorporate real-time weather feeds and LSTM-based time-series analysis can adjust predictions mid-season as extreme events unfold. While no model can perfectly predict a once-in-a-century storm, AI significantly narrows the uncertainty window and triggers early warnings for drought, flooding, and heat stress.
What Is The Difference Between Yield Prediction And Yield Estimation?
Yield prediction is a forward-looking forecast made before harvest, using current and historical data to project future output. Yield estimation is a closer-to-harvest assessment, often based on in-field sampling and crop maturity indicators. AI models can perform both, but their greatest value lies in early-season prediction that informs planning decisions.
How Does Satellite Imagery Improve Crop Yield Prediction Accuracy?
Satellite-derived vegetation indices like NDVI, EVI, and NDRE provide consistent, field-wide measurements of crop health at regular intervals throughout the growing season. This continuous monitoring captures spatial variability that ground-based scouting misses, enabling models to detect stress, disease, and growth patterns across entire farm operations.
What Role Does Data Quality Play In AI Crop Yield Prediction?
Data quality is the single most important factor determining model accuracy. Incomplete records, inconsistent measurement units, or gaps in time-series data will degrade any algorithm’s performance. Investing in standardized and centralized data management before deploying AI is essential for long-term forecasting success.