
Walk into a modern dairy plant, and you will see membrane filtration quietly doing the heavy lifting. Semi-permeable membranes now sit at the center of milk processing, splitting every stream into a retentate (the concentrated fraction you keep) and a permeate (the liquid that passes through). With four core classes: microfiltration, ultrafiltration, nanofiltration, and reverse osmosis, you can tailor pore size and pressure to almost any molecule in milk, from bacteria and casein micelles down to mineral ions.
The payoff is hard to ignore. Membranes already handle a large share of separation work in dairy, with UF, MF, and NF/RO splitting the market roughly a third each. Globally, the membrane filtration market was valued at around USD 19.45 billion in 2024 and is projected to cross USD 48 billion by 2034.
This guide is written for plant managers, QA leads, process engineers, and R&D teams who want more than textbook definitions. You will leave with practical selection rules, a fouling playbook, and the emerging trends that turn membranes into measurable gains in yield and sustainability.
The Basics of Milk Filtration and How Membranes Work
Membrane filtration is a pressure-driven separation. You push milk or whey across a semi-permeable barrier, and transmembrane pressure (TMP) forces selected components through the pores while the rest stays behind as retentate. What you capture depends on two numbers: pore size (in micrometers) and molecular weight cut-off, or MWCO (in Daltons).
Matching the membrane to the molecule is the whole game. Fat globules and bacteria are large, so they need wider pores. Whey proteins are much smaller, so they need a tighter cut-off. Get this wrong, and you either foul the membrane or lose valuable solids into the permeate.
The Four Workhorses of Dairy Processing
The four main classes sit on a spectrum from loosest to tightest, each with its own pressure window and target components.
Microfiltration (MF): Pore sizes of 0.1–1.4 μm run at low pressures (around 0.5–2 bar) and handle bacterial removal, spore reduction, fat separation, and casein fractionation. Properly operated MF with 1.4-μm ceramic membranes can cut total bacterial counts in skim milk by 99.85%, roughly a 2.8 log reduction without thermal damage. That is why MF is central to extended shelf life (ESL) milk and cheese.
Ultrafiltration (UF): With MWCOs between roughly 1 and 100 kDa, UF retains proteins and fat while letting lactose, minerals, and water pass into the permeate. It is the backbone of whey protein concentrate (WPC), whey protein isolate (WPI), milk protein concentrate (MPC), and Greek-style yogurt. UF also dominates by volume, holding roughly 35% of the dairy membrane market.
Nanofiltration (NF): Operating at 10–40 bar, NF selectively removes monovalent ions (sodium, potassium, chloride) while retaining lactose and divalent salts. That makes it ideal for partial demineralization, lactose-free beverages, and reducing whey volume ahead of evaporation.
Reverse Osmosis (RO): The tightest class. RO rejects almost everything except water, so dairies use it to pre-concentrate milk and whey, recover process water, and trim transport and evaporation costs.
Quick reference:
| Process | Pore size / MWCO | Pressure | Retains | Typical dairy use |
|---|---|---|---|---|
| MF | 0.1–1.4 μm | 0.5–2 bar | Bacteria, spores, fat, casein | ESL milk, cheese milk, casein fractionation |
| UF | 1–100 kDa | 1–10 bar | Proteins, fat | WPC, WPI, MPC, yogurt base |
| NF | ~200–1,000 Da | 10–40 bar | Lactose, divalent salts | Lactose-free milk, partial demineralization |
| RO | <200 Da | 20–80 bar | Everything except water | Pre-concentration, water recovery |
Where Membrane Filtration Delivers the Biggest Wins in Dairy
Membranes touch nearly every stream in your plant, from raw milk silos to the wastewater line. Here is where each application delivers the biggest return on investment.
Milk Clarification and Extended Shelf Life (ESL) Milk
Raw milk carries a variable microbial load that heat alone cannot always handle cleanly. Microfiltration strips out vegetative bacteria, spores, and somatic cells mechanically so that the subsequent pasteurization step can be milder and the finished milk holds onto its flavor and native whey proteins.
Cold MF of skim milk at 6°C with a 1.4-μm ceramic membrane delivered a 3.4-log reduction in vegetative bacteria. It combined MF with HTST pasteurization, pushing that to about 4 logs with near-complete elimination of vegetative microflora. Combined MF and mild pasteurization can cut the total bacterial load by 4.6–5.6 log units, pushing chilled ESL shelf life to three weeks or more. Commercially, that means premium fluid milk with fresh-milk sensory attributes and a cleaner route into cheese-making.
Protein Concentration and Fractionation for Premium Ingredients
Ultrafiltration is where most dairies find their biggest margin gains, because it turns a by-product stream (whey) into a premium ingredient.
Whey Protein Concentrate and Isolate (WPC/WPI): UF membranes with 3–10 kDa MWCOs concentrate whey proteins while lactose and minerals flow into the permeate. Diafiltration lifts protein purity from around 35% (WPC-35) to over 90% (WPI).
Milk Protein Concentrate and Isolate (MPC/MPI): UF on skim milk produces MPCs used in cheese, cultured dairy, and high-protein beverages. An MF pretreatment further lowers bacterial and fat load before UF.
Casein and native whey fractionation: 0.1-μm MF cleanly separates casein micelles (retentate) from native whey (permeate), enabling micellar casein isolate and high-purity native whey.
These capabilities unlock entire product categories:
- Greek yogurt, skyr, and quark
- Infant formula and clinical nutrition
- High-protein ready-to-drink beverages and bars
- Functional proteins like lactoferrin, alpha-lactalbumin, and beta-casein
Lactose Reduction and Demineralization With Nanofiltration
Nanofiltration is the quiet hero behind low-lactose, low-sodium, and demineralized dairy. With pores tight enough to hold lactose but loose enough to pass monovalent salts, NF lets you pull sodium chloride, potassium chloride, and other small ions out of whey while concentrating lactose and protein.
Pair NF with electrodialysis, and you can reach the 50–90% demineralization levels required for infant formula whey powders. Follow it with RO and you shrink volume further, slashing freight costs and reducing the energy load on downstream evaporators. Less water to truck, less steam to generate, and a higher-value product at the end of the line.
Water and Resource Recovery for a Sustainable Dairy Plant
Dairies are water-hungry operations. A combined membrane-bioreactor and nanofiltration setup has been shown to cut total freshwater consumption in a dairy plant by up to 69.5%. Real-world deployments back that up: at Molkerei Ammerland in Germany, digital filtration controls cut water use in membrane CIP by 48% and cleaning energy by 77%, saving roughly €180,000 annually. Polished RO and NF permeate is an obvious fit for CIP pre-rinse, boiler feed, and non-product-contact cleaning.
Specialty Products and Next-Generation Dairy Innovation
Membranes are no longer confined to commodity streams. They now enable:
- Milk fat globule membrane (MFGM) and phospholipid isolates for infant and clinical nutrition, via combined MF/UF
- Bioactive peptides and growth factors recovered from whey through selective UF/NF
- Plant-based beverages concentrated and standardized with UF and RO for body and mouthfeel
- Humanized infant formulas that mimic the casein-to-whey ratio of breast milk
How to Design and Select the Right Dairy Membrane System
Good membrane design starts with the end product, not the equipment catalog. Use these five steps to build a line that actually pays for itself.
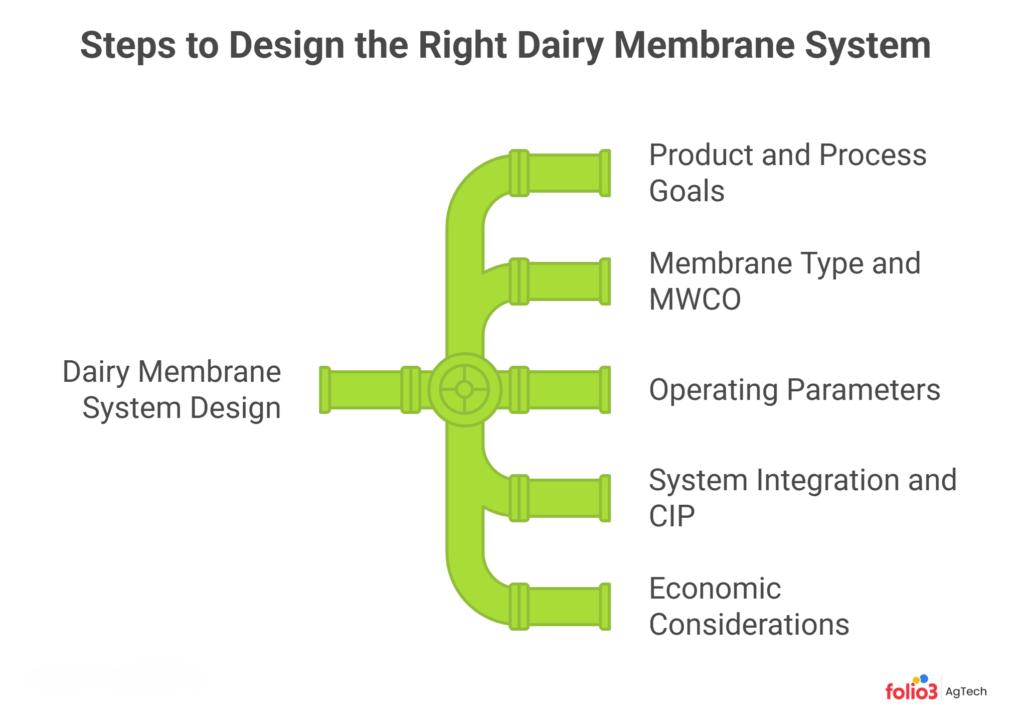
1. Start With Your Product and Process Goals
Before you ask which membrane, ask what you are trying to make. Are you concentrating on protein, removing lactose, recovering water, or all three? Each answer points to a different technology stack. Capture these goals in a short brief before you engage vendors:
- Target protein or solids concentration in the final product
- Acceptable lactose and mineral ranges
- Throughput (liters per hour) and utilization per shift
- Microbial and somatic cell spec of the feed
- Regulatory framework (FDA, EU 853/2004, Codex) and export targets
A one-page brief keeps engineering, QA, and commercial teams aligned and stops scope creep mid-build.
2. Match Membrane Type and MWCO to Your Target Molecules
Molecule size dictates the membrane, not the other way around. A rough map:
- Fat globules (1–10 μm) and bacteria (0.5–5 μm): MF at 0.1–1.4 μm
- Casein micelles (~150 nm) and somatic cells: 0.1-μm MF
- Whey proteins (β-lactoglobulin ~18 kDa, α-lactalbumin ~14 kDa): UF at 5–10 kDa
- Lactose (342 Da) and divalent minerals: NF at 150–300 Da
- Water only: RO
Trade-offs matter. A tighter MWCO gives you higher retention but lower flux and steeper fouling curves. A looser MWCO boosts throughput but may let valuable proteins slip into the permeate. Pilot before you commit, and validate retention and flux with your actual feed rather than supplier brochures.
3. Dial in Pressure, Temperature, and Crossflow Velocity
Pressure, temperature, and crossflow velocity are the three levers that decide whether your membrane delivers its rated performance or fouls in a week. In broad strokes:
- MF runs below 2 bar to keep casein micelles intact
- UF operates at 1–10 bar
- NF pushes 10–40 bar
- RO needs 20–80 bar, depending on osmotic load
Higher pressure buys throughput, up to a point. Past the critical flux, you compact the fouling layer onto the membrane, flux collapses, and CIP frequency explodes. Crossflow velocity (typically 1–6 m/s) shears that layer off and keeps selectivity stable. Temperature is the third lever: warmer feed cuts viscosity and raises flux but accelerates protein denaturation. Run pilots, track permeability and TMP daily, and let data set your setpoints. Integrating IoT sensors and analytics makes that monitoring continuous rather than episodic.
4. System Integration, Scale-up, and CIP Design
Membranes rarely stand alone. MF protects UF upstream; UF pretreats NF; RO pre-concentrates ahead of evaporation and spray drying. Sequencing them correctly cuts energy use and lifts yield. Size the membrane area from the feed volume, concentration factor, and daily uptime. Build in modular skids so you can add area or rotate elements without shutting the plant down, and plan CIP connections, drain points, and instrumentation up front.
5. Economic Considerations and ROI
Cost drivers include membrane type and area, energy, cleaning chemicals, labor, replacement cadence, and CIP downtime. Because membranes avoid phase change, they use far less energy than evaporation for the same concentration duty. Model payback on yield lift, water reuse, and waste reduction together, not on equipment cost alone.
How to Manage Membrane Fouling and Maintenance
Fouling is the tax on membrane filtration. Manage it well, and you keep your flux, flavor, and margins; ignore it, and your CAPEX quietly evaporates.
Four forms of fouling appear on dairy lines:
- Particulate or cake layer fouling from proteins, fats, and colloids
- Scaling from calcium phosphate and other mineral deposits
- Biofouling from biofilms that build up between CIP cycles
- Organic adsorption as proteins bind to the membrane surface
All four cut flux, raise TMP, and shorten membrane life. Cross-flow hydraulics and asymmetric pore structures slow the buildup but do not eliminate it.
Cleaning Strategies and Clean-in-Place (CIP) Best Practices
A standard dairy CIP cycle for polymer membranes runs in this order:
- Water pre-rinse to push product out
- Alkaline wash (typically NaOH-based at 1–2%, 50–60°C) to strip organics
- Intermediate rinse
- Acid wash (nitric or phosphoric) to remove mineral scale
- Sanitization (hot water or an approved oxidizer)
- Final rinse to neutral pH and conductivity
Respect your supplier’s chemical and temperature limits; harsh deviations destroy polymer membranes faster than fouling ever will. Schedule CIP around production batches to minimize downtime, and log every cycle for audit readiness.
Monitoring Membrane Health and Planning Replacement
Don’t guess; measure. Track permeate flux, differential pressure, normalized permeability, and salt or protein rejection every shift. A normalized permeability decline of more than 10–15% that does not recover after CIP is your signal that the membrane is nearing end-of-life. Predictive analytics, paired with strong record keeping across your plant, lets you replace elements on schedule rather than reactively, and negotiate stronger warranties with suppliers.
Emerging Technologies and the Future of Dairy Membrane Filtration
The next wave of membrane technology is already on pilot lines. Here are the developments worth tracking over the next three to five years.
- Polymer nanocomposite and ceramic membranes: New materials are delivering higher flux, better fouling resistance, and longer service life, with ceramic membranes gaining share in demanding duties.
- Self-cleaning and bio-inspired coatings: Anti-fouling surface chemistries reduce CIP frequency, chemical use, and extend element life.
- Smart membranes with integrated sensing: Inline sensors on pressure, flux, and conductivity feed real-time analytics that adjust setpoints automatically.
- Forward osmosis and electrically driven filtration: Low-energy alternatives for concentrating heat-sensitive streams such as bioactive peptides.
- Industry 4.0 and AI-driven control: Machine learning is already being applied to membrane material design and fouling prediction.
- Circular, recyclable membranes: Greener polymers and end-of-life recovery programs are aligning membrane operations with corporate net-zero targets.
Turn Membrane Technology Into a Competitive Edge
Membrane filtration does three things that no other dairy process matches at the same time. It separates precisely, preserves fresh-milk quality, and does it with a fraction of the energy of thermal alternatives. Whether you are concentrating whey protein, extending ESL shelf life, or recovering water for CIP, the right membrane system lifts yield, tightens specs, and trims your environmental footprint.
Start with a clear product brief, match membranes to molecules, pilot before you scale, and treat CIP and monitoring as first-class design elements. Partner early with membrane specialists for pilot testing; the learning pays for itself many times over at full scale. Ready to turn this into measurable gains? Pair your membrane strategy with a purpose-built dairy milk management and ERP platform so every batch, CIP cycle, and yield metric is tracked, audited, and optimized in real time. The dairies that win the next decade will be the ones that make membranes and data work together. Connect with our Agtech experts today to explore more about the implementation.
FAQs
How Is Membrane Filtration Different From Pasteurization?
Pasteurization uses heat to inactivate microbes, while membrane filtration physically separates them based on size. That means membranes can extend shelf life without cooking flavor, color, or native whey proteins out of your milk.
Which Membrane Type Is Best for Cheese Milk Standardization?
Most cheesemakers use 0.1-μm microfiltration for casein standardization, followed by ultrafiltration to fine-tune protein. This combination lifts cheese yield, gives consistent vat composition, and keeps whey clean enough to fractionate downstream.
How Long Do Dairy Membranes Typically Last?
Service life depends on feed, chemistry, and CIP discipline. Spiral-wound polymer membranes usually run 12–36 months in dairy duty, while ceramic elements can last 7–10 years if operated within spec and cleaned on schedule.
Can Small and Mid-Size Dairies Justify a Membrane System?
Yes. Modular, skid-mounted UF and RO units scale down to co-op and artisan volumes. Payback usually comes from higher whey value, water reuse, and reduced evaporation energy, not from raw throughput alone.
Does Membrane Filtration Affect Milk’s Nutritional Value?
Minimally. Membranes work at moderate temperatures without heat shock, so vitamins, immunoglobulins, and native enzymes are preserved better than in UHT processing. That is why MF-based ESL milk is marketed as closer to fresh.
How Do Membranes Support Dairy Sustainability Goals?
They cut energy versus evaporation, recover process water for reuse, and reduce wastewater load. Paired with digital CIP controls, they can trim cleaning water by nearly half and cleaning energy by over 75%.