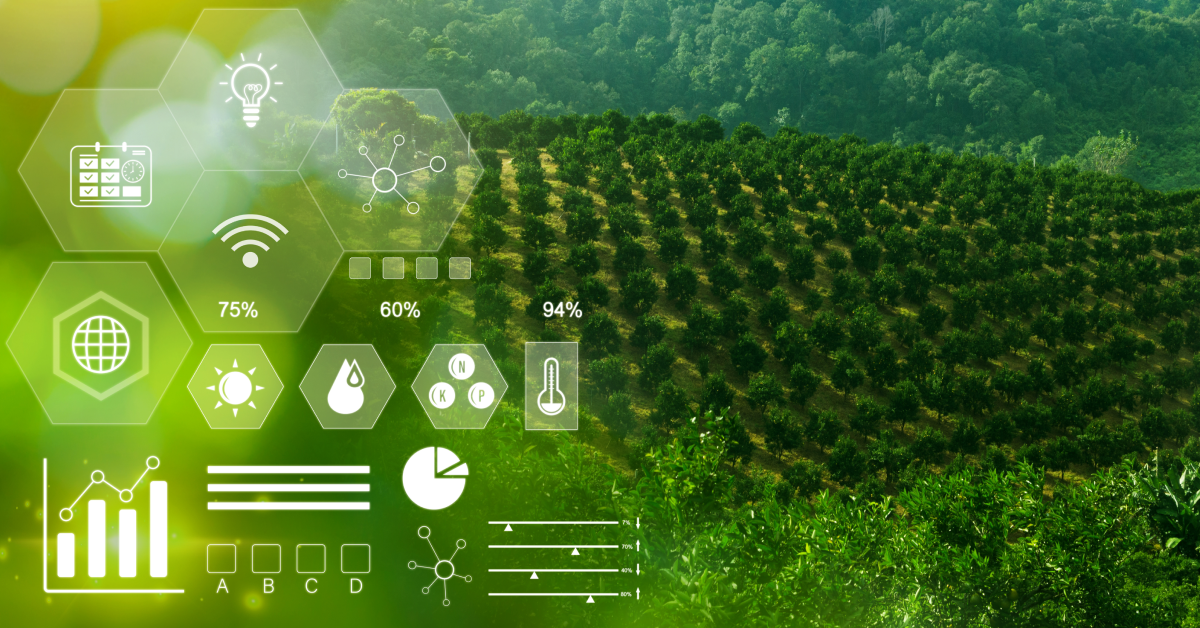
Data is rapidly changing the landscape of modern agriculture. With the rise of precision farming, farmers now have access to vast amounts of data from weather patterns, soil conditions, crop health, and market trends. However, to truly benefit from this influx of information, it must be visualized in a way that allows for informed decision-making.
This is where data visualization in agriculture becomes a game changer. Data visualization in agriculture turns raw data into graphical formats like charts, graphs, and maps, providing clear insights that help in managing crop health, optimizing resources, and predicting yields.
Agriculture industry is getting faced paced day by day and visualization tools, powered by business intelligence (BI), are revolutionizing how farmers, seed producers, processors, and distributors operate. So, keep this blog about how data visualization in agriculture is transforming crop farming!
The Role of Business Intelligence (BI) Tools Data Visualization in Agriculture
Business intelligence (BI) tools, such as Power BI, allow farmers to gather, analyze, and visualize complex agricultural data using advanced statistical analysis. They provide actionable insights that help manage operations more efficiently, from crop production to distribution. Offering customizable dashboards and real-time reporting, BI tools are indispensable for farmers and agribusinesses aiming to optimize crop yields, manage resources, and make better decisions.
Why Power BI for Agriculture?
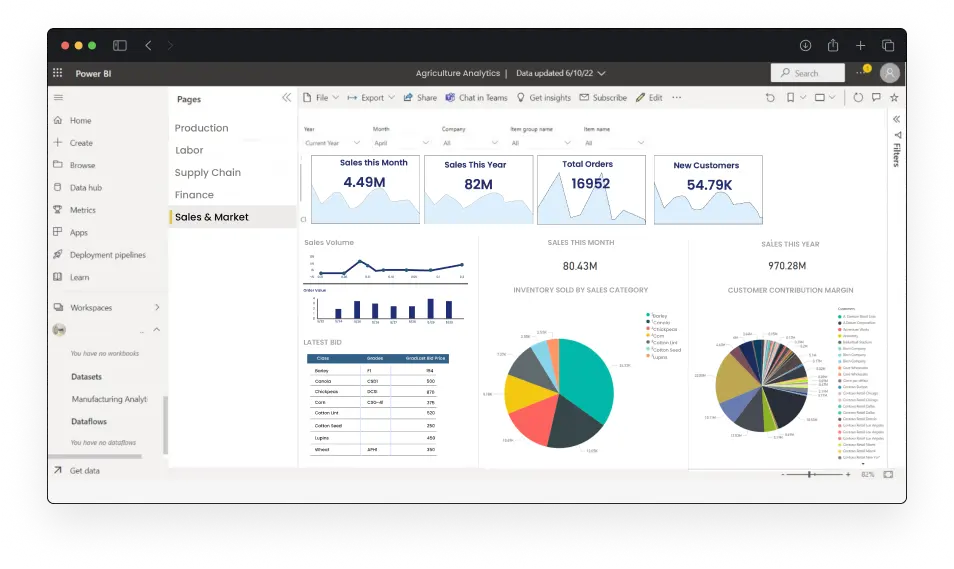
Power BI is one of the leading BI tools that has found widespread application in agriculture. Its ability to process large datasets and turn them into meaningful insights is invaluable in an industry where data complexity can be overwhelming. Some of the standout features of Power BI for agriculture include:
- Customizable Dashboards: Power BI enables users to create dashboards that display key metrics such as soil health, crop growth, weather conditions, and market trends.
- Real-Time Reporting: Farmers can monitor data in real-time, enabling them to make timely decisions such as adjusting irrigation levels or applying fertilizers.
- Predictive Analytics: Power BI integrates with machine learning models, allowing farmers to forecast crop yields and spot potential issues before they arise.
Using these features, agribusinesses can enhance their operations across the entire value chain. For instance, Power BI’s predictive analytics and real-time reporting capabilities help farmers anticipate crop health issues and prevent costly losses. Folio3 offers specialized Power BI for Agriculture services to enable agricultural enterprises to unlock the full potential of their data.
Benefits of Using BI Tools in Crop Management, Resource Allocation, and Predictive Analytics
In modern agriculture, business intelligence (BI) tools play an essential role in optimizing operations, making data-driven decisions, and improving overall productivity. From crop management to resource allocation and predictive analytics, these tools help farmers and agribusinesses stay competitive in a rapidly evolving industry.
Below are the key benefits of using BI tools across these critical areas:
1. Enhanced Crop Management
Effective crop management involves monitoring a variety of variables that influence plant growth and yield. BI tools provide farmers with real-time insights into factors such as soil health, crop conditions, and weather patterns, helping them make timely and informed decisions.
- Disease and Pest Detection: Using remote sensing data and integrating it with BI dashboards, farmers can detect early signs of crop diseases or pest infestations. This early intervention minimizes damage and reduces the need for excessive pesticide use, which helps lower costs and maintain crop quality.
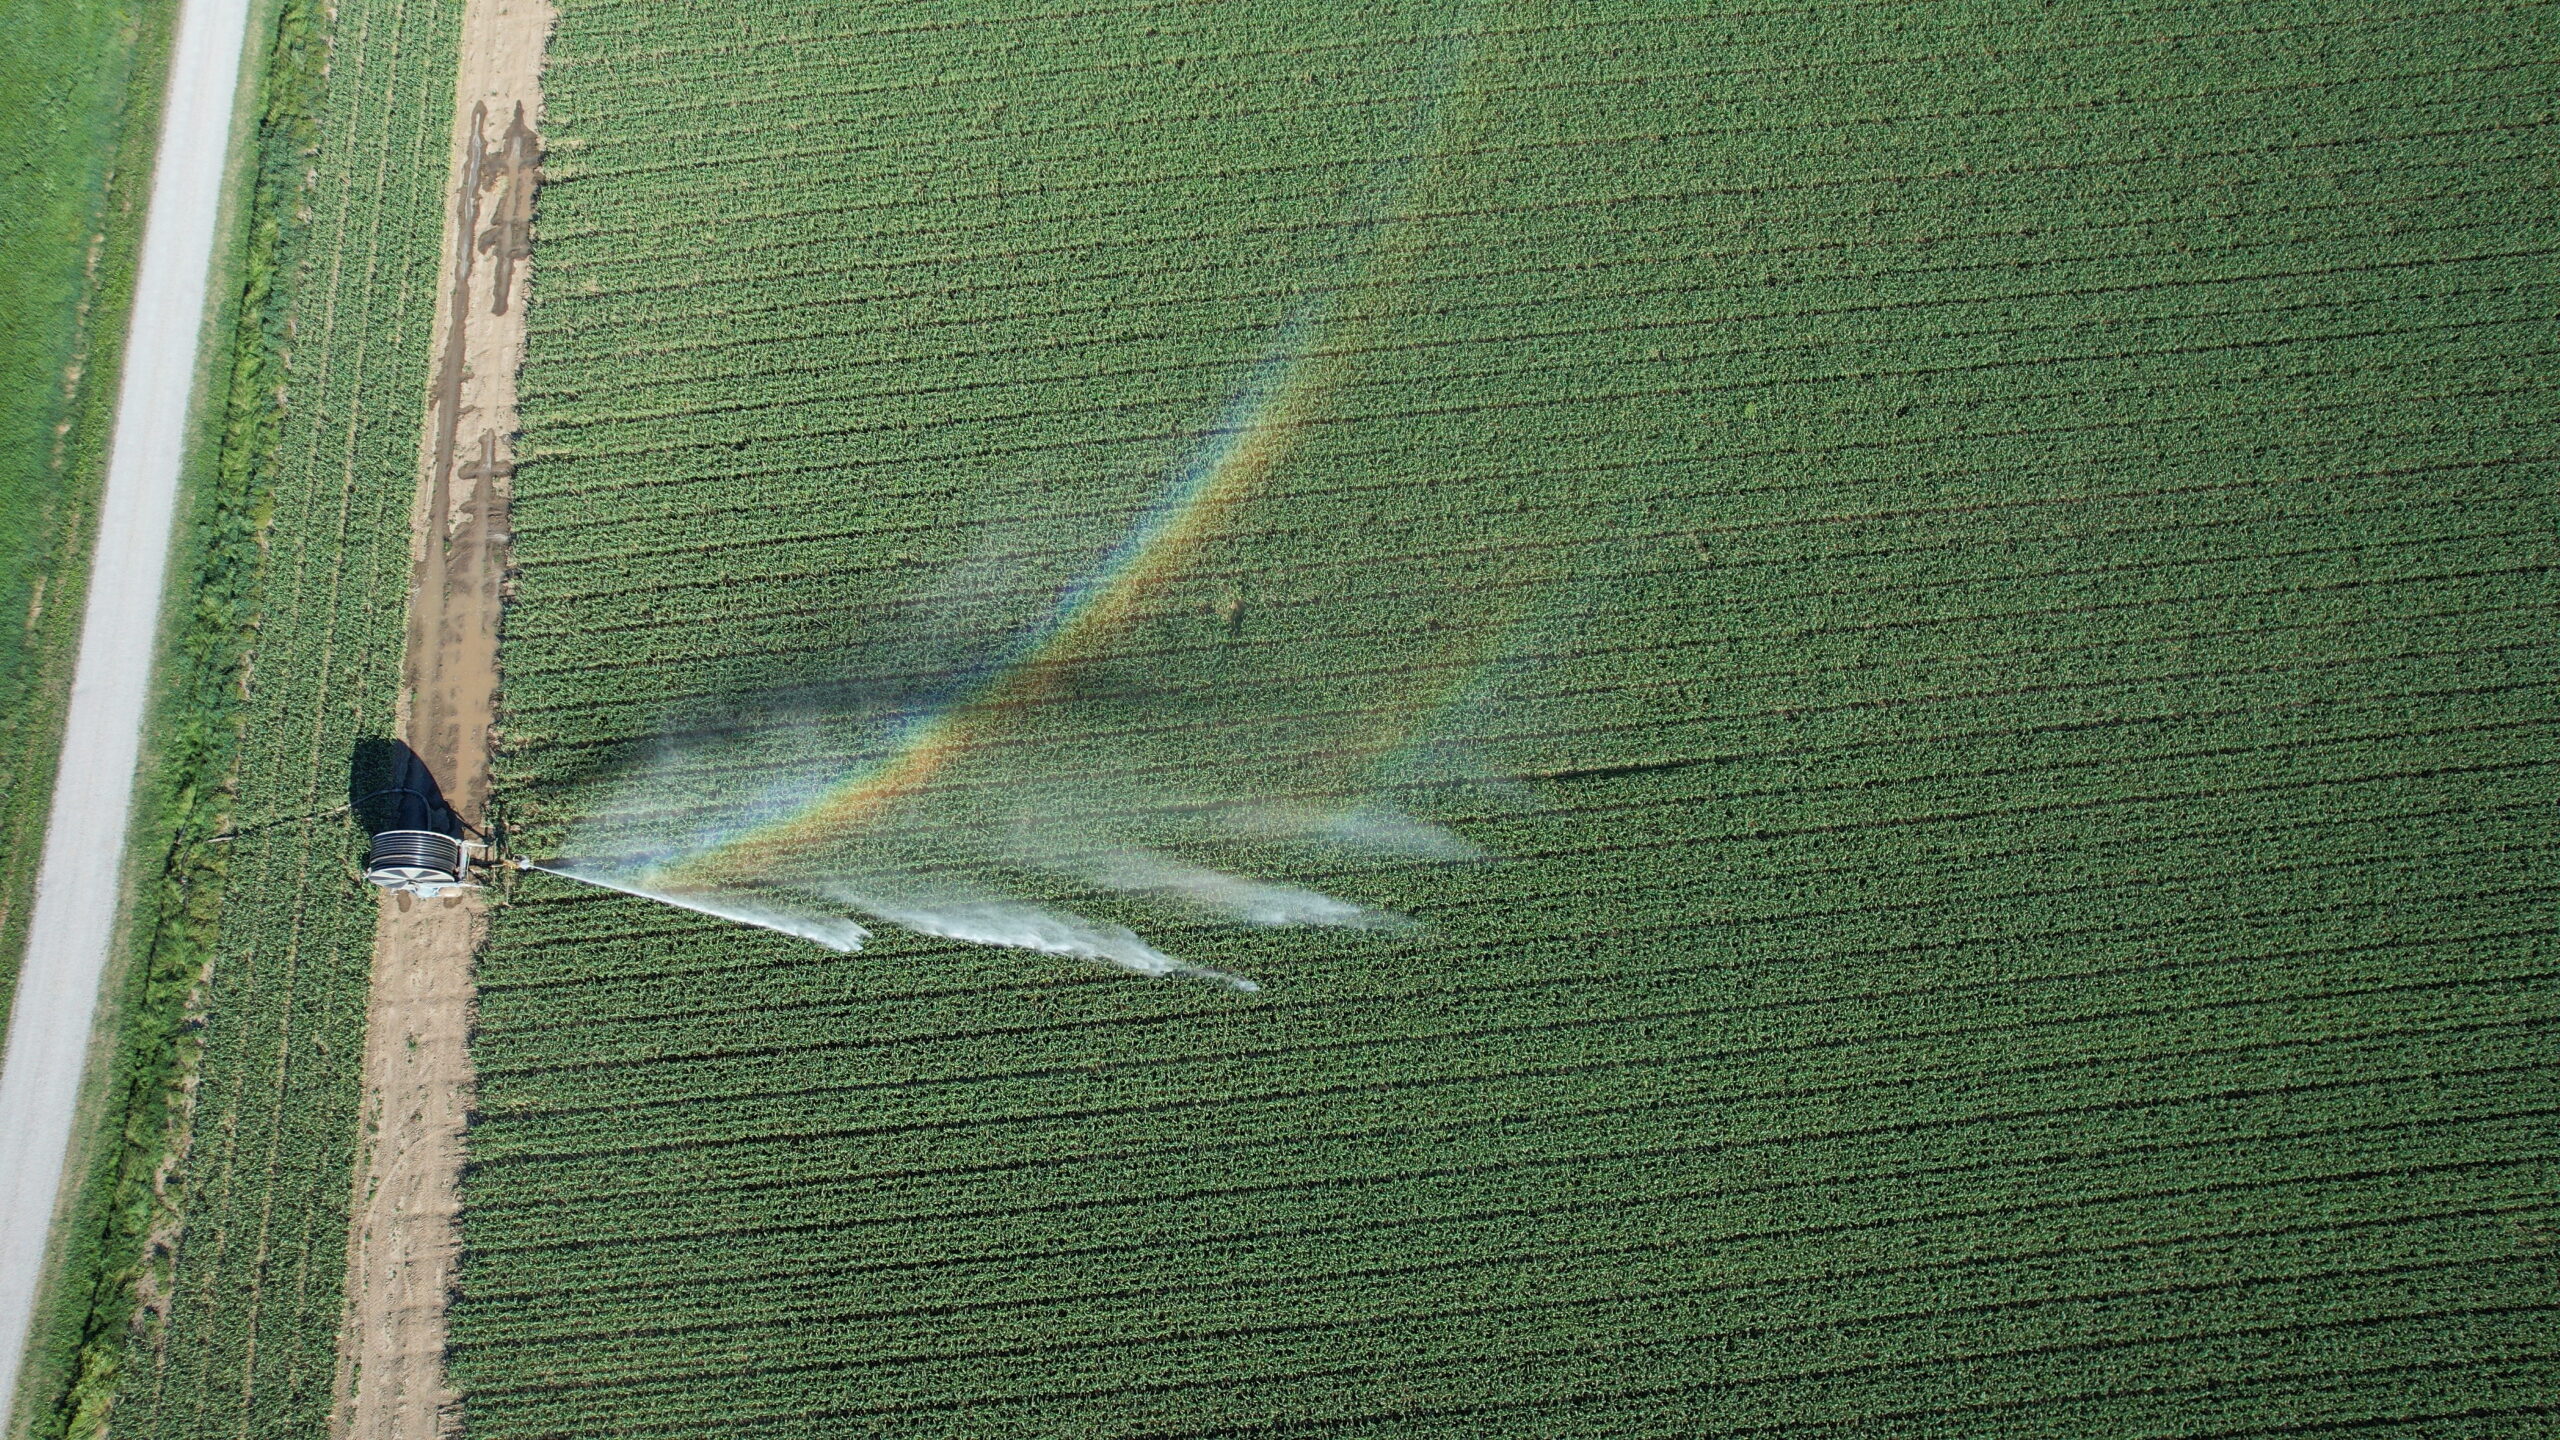
- Optimized Irrigation and Fertilization: Farmers can track water usage and nutrient levels in real-time, allowing them to optimize irrigation schedules and fine-tune fertilization plans based on precise data. This leads to more efficient use of resources, reduced waste, and higher crop yields.
2. Efficient Resource Allocation
Agricultural operations, particularly large-scale farms, must carefully manage resources such as water, fertilizers, and labor to maximize efficiency and profitability. BI tools streamline this process by providing data-driven insights into where and how resources are being used.
- Optimizing Input Use: With detailed data analytics, farmers can optimize the use of water, fertilizers, and other inputs. For example, BI dashboards can show which parts of a field require more water or nutrients and which do not, reducing waste and saving costs while promoting sustainability.
- Labor and Equipment Management: BI tools also allow for better management of labor and machinery. By tracking the performance and maintenance schedules of equipment, farmers can reduce downtime and ensure that resources are deployed where they are most needed, enhancing operational efficiency.
3. Predictive Analytics for Improved Decision-Making
Predictive analytics, a powerful capability of modern BI tools, allows farmers to forecast future trends and make informed decisions based on historical data. This approach helps in risk mitigation and strategic planning, ensuring long-term success in farming operations.
- Yield Forecasting: Predictive analytics can analyze historical crop data, weather patterns, and soil health metrics to forecast future yields. This helps farmers plan their operations more effectively, ensuring that they meet demand while minimizing the risk of crop failure.
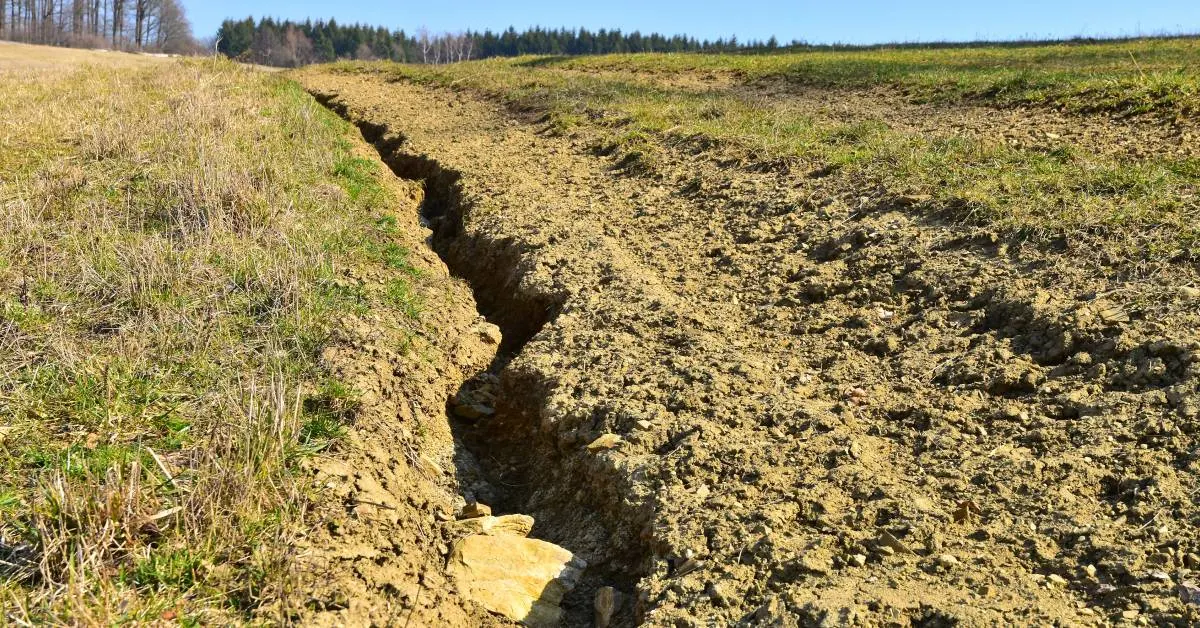
- Weather Impact Prediction: Analyzing historical weather data and current meteorological trends, BI tools can predict how upcoming weather conditions may impact crop growth and harvest times. This allows farmers to prepare in advance, whether that means adjusting irrigation schedules, planting earlier, or investing in protective measures to safeguard crops from adverse weather.
Key Applications of Data Visualization in Crop Farming
Data visualization transforms complex agricultural data into actionable insights to empower:
1. Seed Producers – Driving Innovation with Data
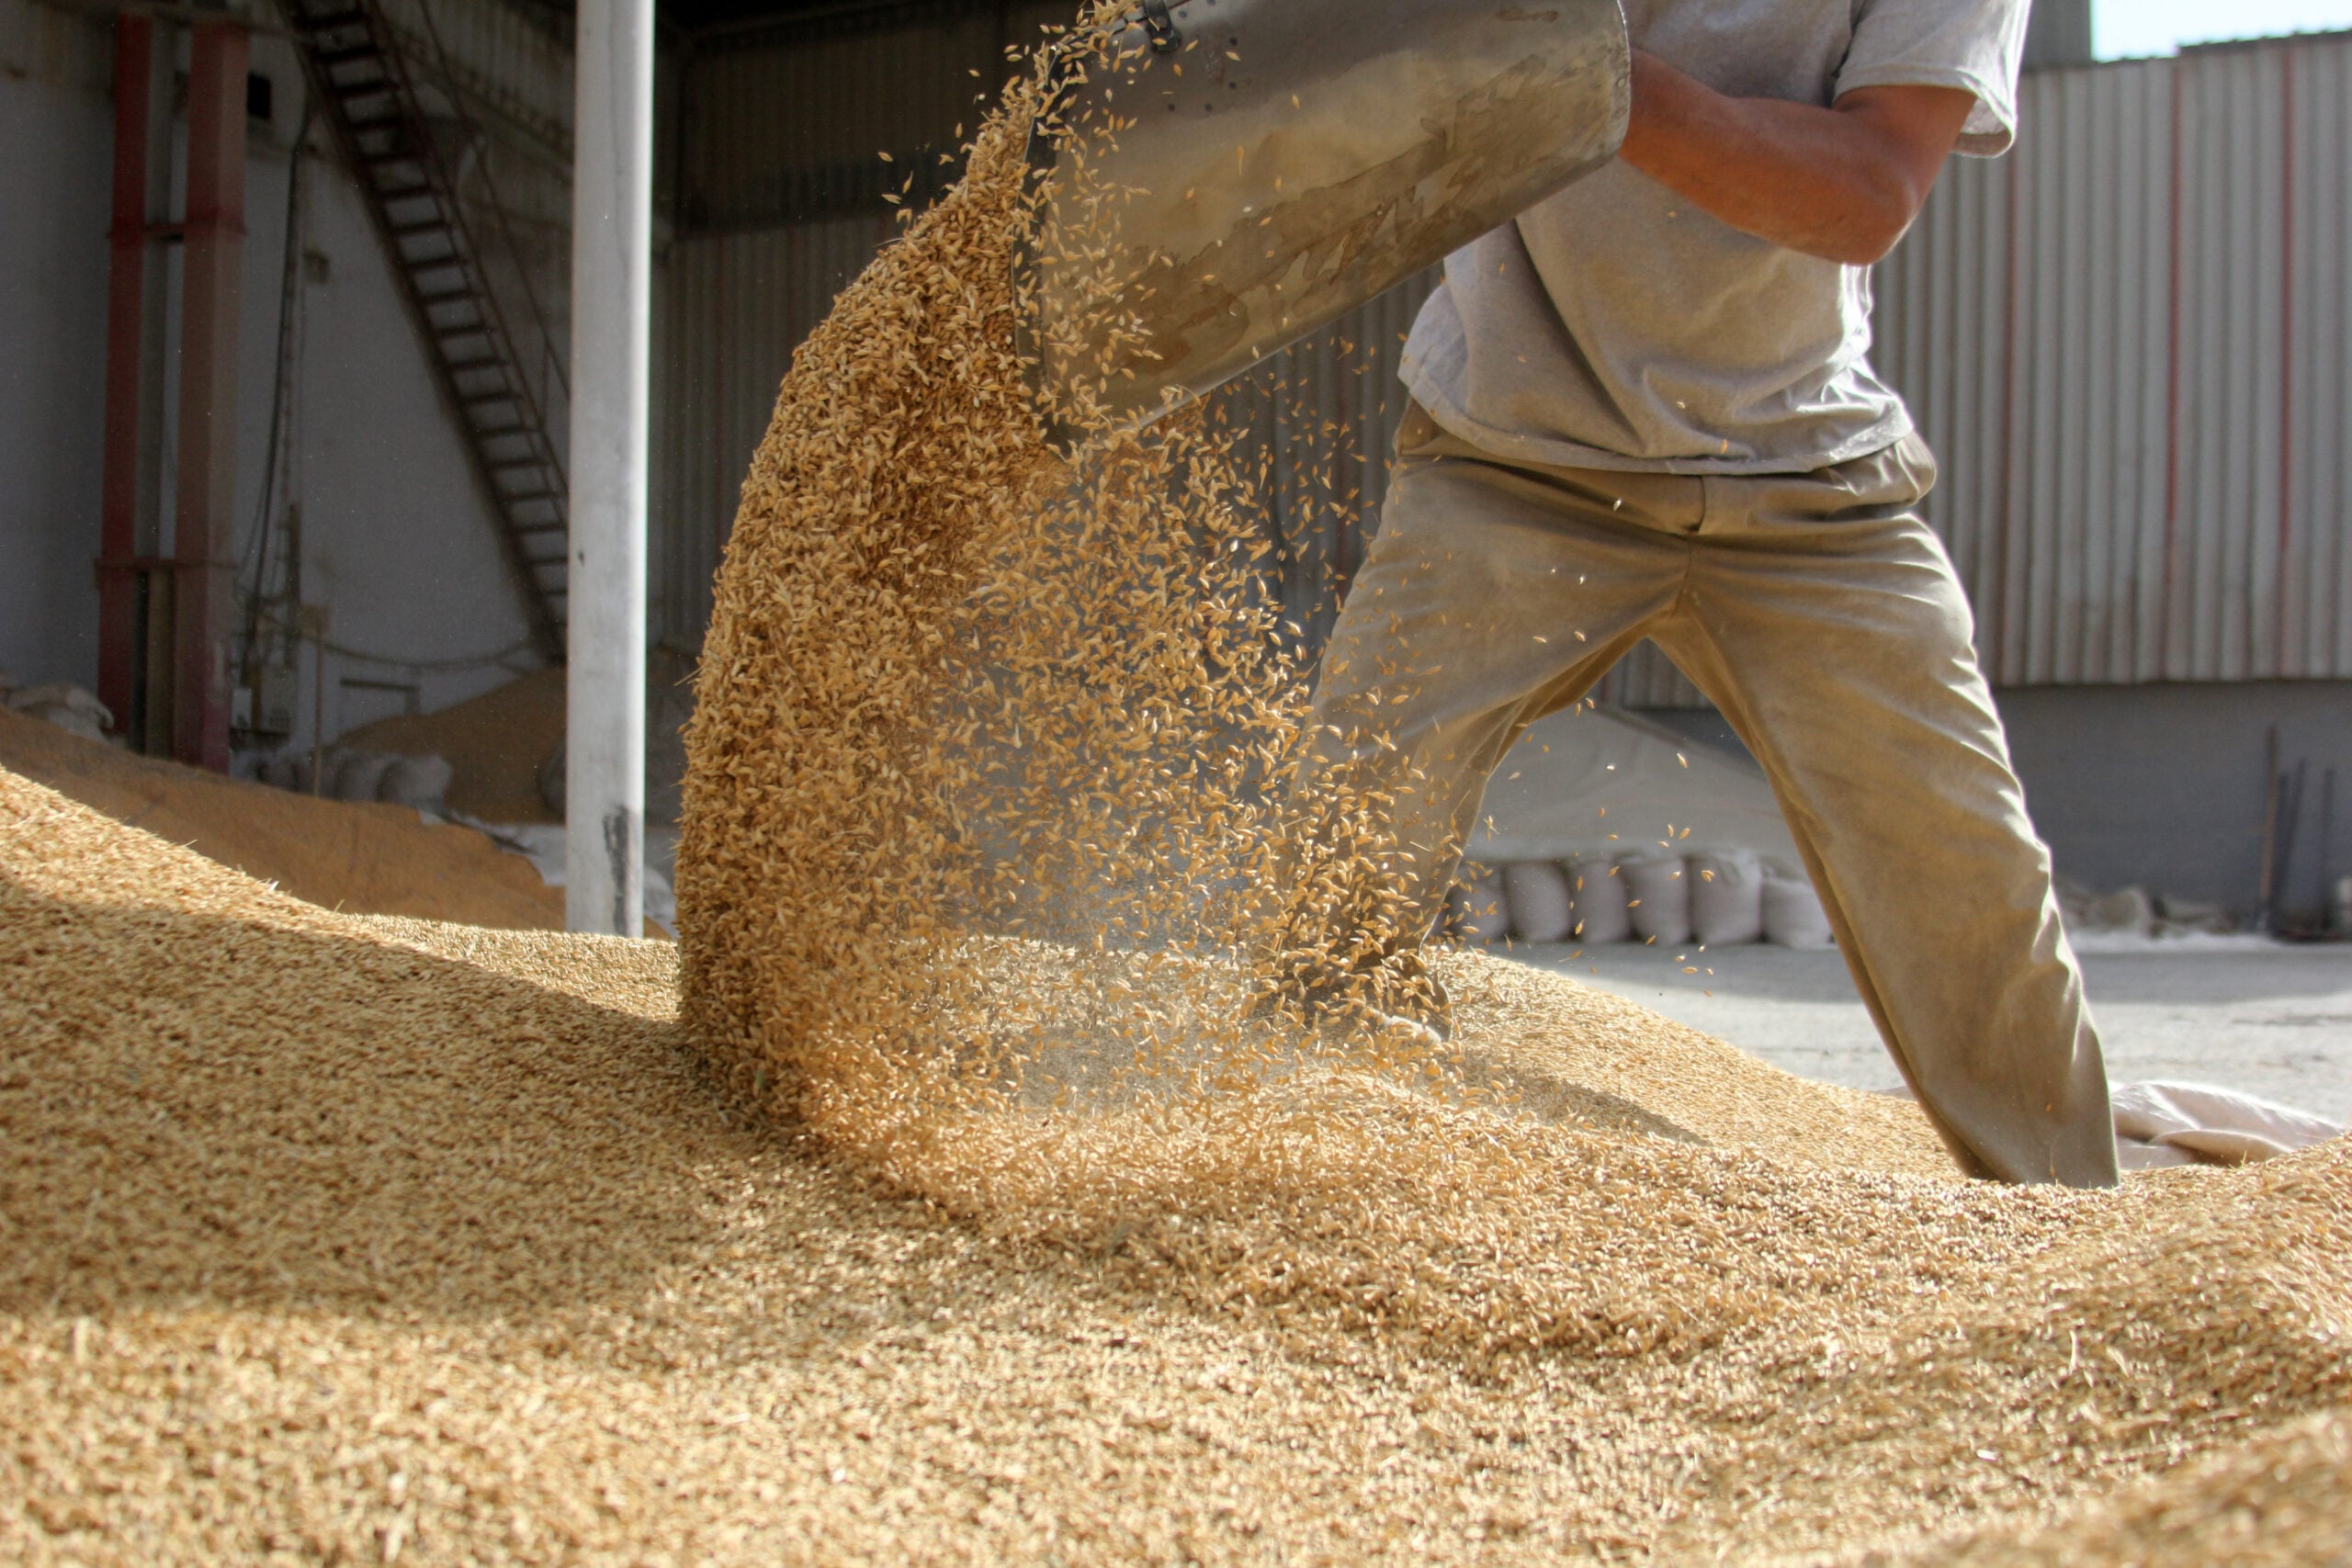
Seed producers rely on trial data to create new varieties that will perform well under varying conditions. With the help of BI tools, seed companies can track the outcomes of seed trials in different climates and soil conditions. These insights allow them to make data-driven decisions about which seed varieties to produce in larger quantities.
For instance, Folio3 AgTech helps seed companies visualize trial data, ensuring more effective inventory management and improved selection of seed varieties based on performance. This not only leads to better yields but also fosters innovation in seed development.
2. Crop Growers – Optimizing Planting and Harvesting
For crop growers, understanding the precise timing of planting and harvesting can make the difference between a bumper crop and a poor yield. Data visualization in agriculture tools monitor key factors such as soil moisture levels, temperature, and crop health in real-time.
Folio3 AgTech provides growers with easy-to-read dashboards that integrate remote sensing data, allowing them to keep track of soil health and crop conditions. With the help of such tools, farmers can optimize irrigation schedules, monitor plant health, and fine-tune their fertilization strategies, resulting in improved yields and resource efficiency.
At Folio3, we specialize in helping agricultural businesses harness the power of data visualization in agriculture through comprehensive business intelligence solutions. One of our success stories is Growers Express, a leading agricultural company known for its premium produce brands like Green Giant Fresh.
Growers Express partnered with Folio3 to overcome challenges in manual data processing and lack of real-time insights. Folio3’s customized BI tools enabled them to automate reporting, track crop health, and optimize crop planning.
Visualizing critical data such as soil conditions and inventory, Growers Express significantly improved decision-making and operational efficiency, resulting in better crop yields and resource management. This showcases how data visualization in agriculture can help crop growers achieve precision in planting and harvesting decisions for optimized outcomes.
3. Crop Processors – Enhancing Product Quality and Efficiency
Crop processors face the challenge of maintaining product quality while reducing waste and energy consumption. BI tools provide real-time tracking of energy usage, equipment maintenance, and product quality metrics, allowing processors to streamline operations.
Folio3 AgTech’s analytics platform enables crop processors to visualize and analyze data regarding resource consumption and product quality, helping them reduce waste and optimize energy use. This ensures better product quality while minimizing operational costs, ultimately improving profitability.
4. Distributors & Retailers: Streamlining Supply Chain and Sales
Efficient logistics and supply chain management are crucial for agricultural distributors and retailers. BI tools allow for better demand forecasting, helping to reduce supply chain bottlenecks and enhance sales strategies.
Folio3 AgTech offers Power BI solutions that provide distributors and retailers with insights into market demand, inventory levels, and shipping timelines. Visualizing this data, businesses can improve delivery times, reduce costs, and meet consumer demands more effectively.
Conclusion – How to Empower Your Crop Business with Folio3 AgTech?
The future of agriculture lies in data. From seed producers to retailers, data visualization in agriculture powered by BI tools like Power BI is helping businesses make smarter decisions, optimize resources, and boost crop yields. With Folio3 AgTech’s business intelligence solutions, agricultural businesses can leverage the power of data to drive efficiency across the entire supply chain.
Whether you’re a seed producer looking to innovate, a grower aiming for better yields, or a processor seeking to optimize operations, Folio3 AgTech’s data visualization in agriculture tools can transform the way you do business. Explore Folio3 AgTech solutions today and experience new growth opportunities for your farm.
FAQs
What is Data Visualization in Agriculture?
Data visualization in agriculture refers to the use of graphical representations like charts, graphs, and maps to help farmers understand complex agricultural data for better decision-making.
How Does Power BI Help in Agriculture?
Power BI provides real-time data insights, customizable dashboards, and predictive analytics, allowing farmers to visualize critical data points such as crop health, soil conditions, and market trends.
What are the Benefits of Using Business Intelligence Tools in Crop Farming?
BI tools help farmers make informed decisions, optimize resource usage, and predict crop yields, leading to improved efficiency and profitability in farming operations.
How Can Folio3 AgTech Help My Farm?
Folio3 AgTech offers specialized business intelligence solutions for agriculture, including data visualization in agriculture tools that enhance crop management, resource allocation, and overall operational efficiency.
Can Data Visualization in Agriculture Improve Crop Yield?
Yes, by providing clear insights into factors like soil health, irrigation needs, and weather patterns, data visualization in agriculture helps farmers optimize planting and harvesting, which can significantly improve crop yields.