

Variable rate technology (VRT) is a precision agriculture method that automatically adjusts input application rates like seed, fertilizer, water, or chemicals as equipment moves across a field. Instead of treating every acre identically, VRT delivers exactly what each zone needs based on soil conditions, yield potential, or crop requirements.
Think of it this way: you’re topdressing nitrogen on a 500-acre field. One corner has heavy clay soils with a strong yield history; the opposite side runs sandier with lower organic matter. Uniform application wastes money on the low-potential zones and starves the high-performers. VRT solves this by varying rates automatically; 70 lbs/acre on sand, 120 lbs/acre on clay without stopping the tractor. The result is better input efficiency, improved yields, and measurable cost savings.
VRT vs. VRA vs. “Precision Ag”
The terms often get used interchangeably, but they’re not identical. Variable Rate Technology (VRT) refers to the hardware and software systems that enable variable application like controllers, GPS receivers, prescription software, and rate-adjusting equipment.
Meanwhile, Variable Rate Application (VRA) is the actual practice of applying inputs at different rates across a field using VRT equipment.
Precision agriculture is the broader umbrella covering all site-specific management practices, including yield mapping, soil sampling, GPS guidance, remote sensing, and VRT. VRT is one tool within the precision ag toolkit, arguably the one that delivers the most direct ROI impact for operators managing high-variability fields.
Learn more about how precision agriculture technology transforms modern farming operations.
Why Fields Don’t Respond Uniformly and Why VRT Is the Practical Fix
Uniform-rate application treats every part of your field as identical when it clearly isn’t. This “one size fits all” approach creates three compounding problems.
- First, you overspend on inputs in low-response zones where extra fertilizer or seed won’t produce extra yield.
- Second, you underapply in high-potential areas, leaving yield on the table.
- Third, excess inputs in sensitive zones increase environmental risk through runoff, leaching, and soil degradation.
This uniform approach often leads to either under- or over-applications that impact environmental sustainability and farm economics, consequences that compound season after season.
Where VRT Wins Most
VRT delivers the most substantial returns where within-field variability is significant and input costs are high. Fields with variable soil types, rolling topography, inconsistent drainage, or patchy yield histories are prime candidates. The economic case becomes even stronger for expensive inputs like anhydrous ammonia, specialty fertilizers, or precision-placed seed.
For uniform fields with consistent soils and flat topography, VRT’s value diminishes, there’s less variability to manage. But if your combine yield monitor shows 80-bushel swings across the same field, VRT can turn that variability from a liability into an optimization opportunity. Understanding your field’s specific conditions is essential, and modern crop management software makes this analysis practical for any operation.
How Does VRT Actually Work End-to-End? The 5-Step Workflow Operators Follow
VRT follows a clear five-step process: capture field variability, build management zones, create prescriptions, execute with GPS-enabled equipment, then verify results against yield data.
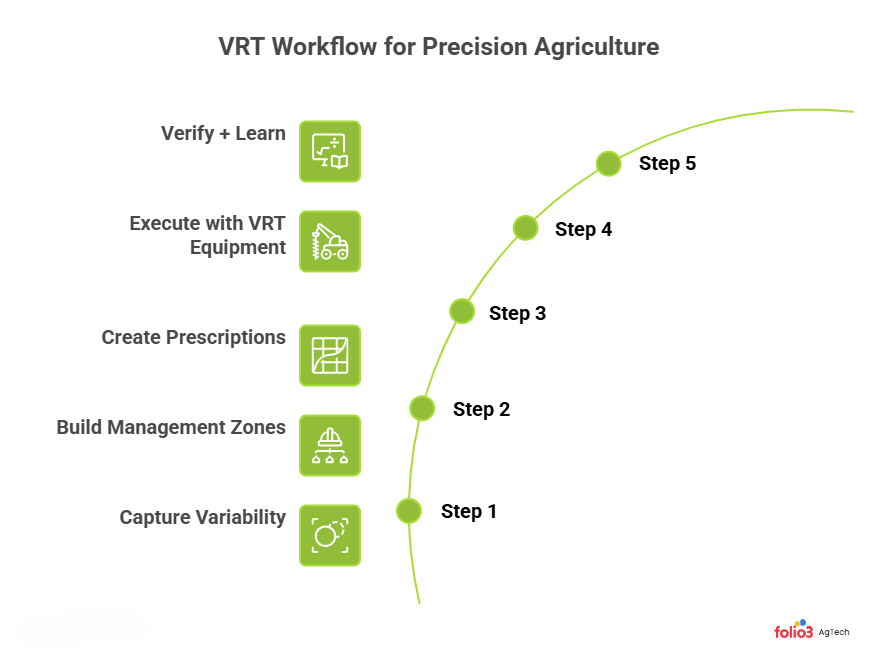
Step 1: Capture Variability
Everything starts with data that quantifies within-field variability. Common sources include multi-year yield maps from your combine, soil electrical conductivity (EC) surveys, grid or zone soil sampling results, satellite or drone imagery, and topographic data. The goal is identifying stable patterns, areas that consistently outperform or underperform and understanding the underlying causes. Data analytics in agriculture has transformed how operators capture and interpret these variability signals.
Step 2: Build Management Zones
Management zones group areas with similar yield potential, soil characteristics, or crop response into actionable units. The key is balance: too few zones ignore real variability; too many create prescription complexity that exceeds equipment resolution or agronomic value. Most operators start with 3-5 zones per field, defined by combining yield history, soil texture, and topography. Resist the temptation to micro-zone based on every data point, sofocus on meaningful, agronomically distinct areas.
Step 3: Create Prescriptions
Static prescriptions are built pre-season using historical data like yield maps, soil tests, EC surveys and remain fixed throughout application. They work well for seeding, lime, and P&K fertilizers where requirements change slowly. Dynamic prescriptions incorporate in-season data like current crop canopy status (NDVI), soil moisture, or real-time sensor readings to adjust rates responsively. Nitrogen sidedress is the classic dynamic VRT application.
Step 4: Execute with VRT-Enabled Equipment
The prescription file uploads to a VRT-capable controller that communicates with rate-adjusting equipment while GPS/GNSS provides real-time position data. As the implement moves, the controller continuously adjusts output to match the prescription for each location. Accuracy depends on GPS precision, controller response time, and equipment calibration.
Step 5: Verify + Learn for Next Season
As-applied maps document actual application rates versus prescription targets, essential for verification and continuous improvement. Compare as-applied data against subsequent yield results to validate zone logic. Did the high-rate zones actually produce better? Did low-rate zones maintain yield at reduced cost? This feedback loop refines prescriptions for future seasons.
VRT Workflow Summary: Capture Variability → Build Management Zones → Create Prescription → Execute Application → Verify & Learn
Map-Based vs. Sensor-Based VRT: Which Approach Fits Your Farm and Why?
Map-based VRT uses historical data for planned applications like seeding and lime. Sensor-based adjusts rates in real-time, ideal for nitrogen topdress and variable conditions.
Map-Based VRT
Map-based VRT uses pre-generated prescription maps uploaded to equipment controllers. These prescriptions draw from historical yield data, soil sampling results, EC mapping, satellite imagery, and other spatial data layers analyzed before fieldwork begins. Map-based VRT dominates current adoption because it integrates well with existing farm management workflows and doesn’t require specialized real-time sensing equipment.
Map-based approaches excel for inputs where requirements change slowly like seeding rates, lime, phosphorus, potassium and where consistent, repeatable prescriptions add value. The main requirement is quality input data and the expertise to translate that data into defensible rate recommendations.
Sensor-Based / On-the-Go VRT
Sensor-based VRT uses real-time measurements to determine application rates as equipment moves through the field, no pre-built prescription required. Active crop canopy sensors measure plant vigor and calculate nitrogen needs on the go. This approach captures current crop conditions rather than relying solely on historical patterns.
Sensor-based VRT shines for in-season nitrogen management where crop demand varies with weather, emergence, and early-season stress. It’s also valuable for targeted spraying applications where weed or pest pressure is patchy. The tradeoff is higher equipment cost and the need for proper calibration. For operations considering irrigation optimization, sensor-based approaches paired with soil moisture monitoring can dramatically improve water use efficiency.
Hybrid + AI Decision Support
Leading precision agriculture programs combine both approaches. Map-based prescriptions provide the foundation using proven zone logic, while sensor-based adjustments fine-tune rates based on current conditions. Emerging AI solutions for agriculture accelerate this integration. The machine learning algorithms process multiple data streams to generate optimized prescriptions that adapt through the season.
VRT Approaches Compared:
| Approach | Data Needed | Best For | Pros | Watch-Outs |
| Map-Based | Soil/yield/imagery layers → prescription | Fertilizer, seeding, lime | Repeatable, scalable | Needs good maps + setup |
| Sensor-Based | Real-time sensing (crop/soil/weed) | N topdress, targeted spray, orchards | Responsive to current conditions | Higher capex, calibration |
| Hybrid | Both map + real-time data | Highest-performance programs | Best of both approaches | Data & workflow maturity required |
What Can You Apply with VRT? Use Cases That Pay Back First
Fertilizer VRT delivers the fastest ROI on high-variability fields. Seeding, weed control, and irrigation follow, so start with your most expensive input showing variable response.
Variable Rate Fertilizer & Lime
Fertilizer VRT represents the largest adoption segment, accounting for approximately 40% of the VRT market according to industry analysis. The economics are straightforward: fertilizer costs are high, crop response varies predictably with soil fertility levels, and the verification path is clear through tissue tests and yield comparison.
Lime applications benefit similarly from VRT, as soil pH varies substantially across fields due to parent material, drainage patterns, and historical management. Applying 2 tons/acre where only 1 ton is needed wastes money; applying 1 ton where 3 tons are required limits nutrient availability and yield potential. VRT prescriptions built from grid soil sampling or zone testing deliver the right rate to each area.
Variable Rate Seeding
Variable rate seeding adjusts plant populations to match each zone’s yield potential and resource capacity. High-productivity zones with adequate water-holding capacity support higher populations; drought-prone or low-fertility zones perform better with reduced seeding rates that prevent plant competition. USDA data shows VRT for seeds is used by 32% of large-scale farms in 2023, with adoption accelerating as seed costs rise.
Variable Rate Weed Control / Crop Protection
Weed and pest pressure is rarely uniform across fields. Waterways harbor different species than hilltops; field edges face different pressure than centers. VRT spray applications target infested zones with appropriate rates while reducing or eliminating applications in clean areas. This precision approach cuts chemical costs, reduces environmental loading, and preserves crop safety. Early-season weed mapping through smart farming technology enables these targeted prescriptions.
Variable Rate Irrigation
Variable rate irrigation (VRI) adjusts water application across different field zones using modified center pivot or linear systems. Fields with variable soil water-holding capacity, slopes that cause runoff, or areas with shallow groundwater benefit most. VRI reduces water waste in low-need zones while ensuring adequate delivery to high-demand areas, particularly valuable where water costs are high, or allocations are limited.
VRT Starting Point Framework: Start with the input that is expensive, variable in response across your field, and easiest to verify through yield or soil testing.
What Data Layers Make VRT Prescriptions Trustworthy?
Reliable prescriptions need multi-year yield history, soil EC surveys, and grid sampling for stable zones. In-season NDVI and moisture data drive dynamic nitrogen decisions.
Baseline Layers for Stable Zones
Stable zone delineation requires data layers that reflect persistent field characteristics rather than single-season anomalies. Multi-year yield history (minimum 3-5 years) reveals consistent productivity patterns. Soil electrical conductivity (EC) surveys quantify texture and drainage variability. Grid or zone soil sampling provides nutrient baselines. Topographic data from RTK GPS or LiDAR identifies drainage patterns and slope positions.
The value lies in convergencenwhere multiple layers agree. A persistent low-yield zone that also shows high EC (heavy clay), low topographic position (wet), and low soil test K probably has legitimate agronomic limitations. A single-year yield dip without corroborating data might just reflect equipment issues or weather anomalies.
In-Season Layers for Dynamic Decisions
Dynamic prescriptions require current-season data that reflects actual crop status. NDVI and other vegetation indices from satellite or drone imagery quantify canopy vigor and biomass. Canopy temperature sensing identifies water stress before visible wilting. Soil moisture sensors track plant-available water in real-time. These layers enable responsive applications like nitrogen topdress timing, rescue irrigation triggers, or late-season fungicide targeting.
Data-Quality Rules That Prevent “Bad VRT”
Poor data produces poor prescriptions. Yield maps need proper calibration, moisture correction, and header-height filtering. Soil sampling density must match management zone size, a 2.5-acre grid sample shouldn’t drive decisions on 20-acre zones. Imagery timing matters; mid-season NDVI works for nitrogen, but post-canopy-closure images miss early variability. The discipline of data visualization in agriculture helps operators identify data quality issues before they corrupt prescriptions.
| Input | Best Data Layers | Typical Timing |
| Nitrogen Topdress | NDVI + N-rich strip calibration + yield zones | In-season (V6-V10 corn) |
| Lime | Soil pH + buffer pH + EC/texture zones | Fall/pre-season |
| Seeding | Yield history + soil water holding + topography | Pre-season planning |
The VRT Tech Stack Buyers Actually Need
Essential gear includes a VRT-capable controller, accurate GPS receiver, rate-control hardware, and compatible applicators. Farm management software ties everything together for prescription export.
Machinery Capability Checklist
Essential VRT equipment components include:
- VRT-capable controller that reads prescription files and outputs rate commands
- DGPS/GNSS receiver with sub-meter or better accuracy
- Rate-control hardware
- Compatible applicator equipment
- Display/interface showing prescription, current rate, and field position
Prescription Files + Data Flow
Prescription files must be exported from farm management software in formats your controller accepts, commonly Shapefile (.shp), ISO-XML, or manufacturer-specific formats. Data flow between office software and field equipment remains a friction point; verify format compatibility before investing. Modern farm management software solutions increasingly support universal export formats to reduce compatibility headaches.
Why Farm Management Software Matters
A central farm management platform serves as the single source of truth, integrating yield maps, soil data, imagery, prescriptions, and as-applied records. This consolidation enables prescription refinement across seasons, traceability for compliance requirements, and clear ROI tracking. Without integrated software, VRT becomes a series of disconnected projects rather than a continuous improvement program.
Explore how ERP solutions for agriculture can unify your data infrastructure.
What Does VRT ROI Look Like? How to Estimate Payback Without Hand-Waving
VRT generates returns through three channels. Input savings result from reducing rates in low-response zones as VRT can reduce fertilizer application by 15-30% in appropriate fields. Yield lift comes from optimizing rates in high-potential zones that were previously under-applied. Risk reduction includes avoiding over-application consequences and improving crop uniformity.
A Simple ROI Model Operators Can Run
- Calculate your baseline: total input cost (fertilizer/seed/chemical) × acres treated. Estimate VRT savings potential: percent of acres in low-response zones × rate reduction × input cost per unit.
- Add yield gain value: estimated bushel increase per acre on under-applied zones × grain price × zone acres.
- Subtract VRT costs: equipment, software subscriptions, and prescription development time.
The math should clearly show whether VRT pays in your specific situation.
Benchmarks to Reference With Context
Analysis shows VRT improved operating profits by approximately 1.1% on adopting farms. It is meaningful at scale but dependent on field variability and implementation quality. Earlier ERS studies found that GPS mapping increased earnings by nearly 3%, illustrating the value of the foundational data infrastructure that enables effective VRT. High-variability fields in high-value crops will see returns above these averages; uniform fields or low-margin commodities may see less.
Implementation Roadmap to Run Your First VRT Pilot in One Season
Start with one high-variability field and one input. Define success metrics upfront, build 3-5 zones, calibrate equipment, then compare yield against uniform-rate controls.
Pre-Season: Pick the Right Field + Define Success Metrics
Select a pilot field with documented yield variability, known soil variation, and accessibility for monitoring. Define specific success metrics before starting: target input savings ($/acre), expected yield maintenance or improvement (bu/acre), and verification method. Establish a control area treated at uniform rates for direct comparison.
Build Zones + Prescriptions: Start Simple, Document Assumptions
Begin with 3-5 zones based on yield history and available soil data. Document the agronomic rationale for each zone’s rate ,what data supports this recommendation? Keep prescriptions conservative initially; aggressive rate cuts risk yield loss that undermines the pilot. Use precision farming software to streamline zone development and prescription creation.
In-Field Execution: Calibration, Speed Effects, As-Applied Checks
Calibrate applicator equipment before VRT runs, controller output means nothing if product flow doesn’t match. Monitor ground speed; rate controllers struggle with rapid speed changes. Collect as-applied data to verify prescription execution, spot-check actual rates against prescribed rates in the field.
Post-Harvest Review: Compare Zones, Validate Response, Update Logic
Compare yield results by zone against as-applied rates and previous uniform seasons. Calculate actual input savings and yield impact. Identify zones where prescriptions performed well and zones requiring adjustment. Document learnings to refine next season’s approach.
Operator QA Checklist: Equipment calibration → Nozzle/flow checks → Boundary validation → Prescription sanity check → As-applied map review → Post-season yield comparison
Agricultural VRT Market and Adoption
USDA Agricultural Resource Management Survey data confirms VRT adoption increases with farm scale. Large farms (third quintile of acreage and above) show adoption rates of 50%+ for yield maps, soil maps, and VRT, while farms in the first quintile remain below 25%.
This pattern reflects scale economics, larger operations spread fixed technology costs across more production units, generating faster payback. VRT adoption for corn reached 37.4% of planted acres by 2016, up from 11.5% in 2005, demonstrating sustained growth across the industry.
Market Outlook
Industry analysis segments the VRT market by implementation method and offering type.
- The services segment including prescription development, data management, and agronomic consulting is growing as operators seek expertise without building internal capacity.
- Sensor-based adoption accelerates as equipment costs decline and AI-powered calibration simplifies setup.
Where to Start This Week And How to Avoid Expensive Missteps
Variable rate technology isn’t about buying equipment, it’s about systematically matching inputs to field variability for measurable economic and agronomic returns. The operators seeing the strongest results start with quality data, build defensible prescriptions, and verify performance rigorously.
Your three-step action plan:
(1) Pick one field with documented yield variability and existing data layers.
(2) Pick one input, likely fertilizer where you can clearly measure savings and yield response.
(3) Define one measurable success metric before you start, then track it through harvest.
Ready to move forward with precision agriculture on your operation? Request a VRT readiness assessment to evaluate your current data infrastructure, identify high-impact pilot opportunities, and develop a practical implementation roadmap tailored to your fields and equipment.
FAQs
What is variable rate technology (VRT)?
VRT is precision agriculture equipment that automatically adjusts input application rates like seed, fertilizer, chemicals, water as machinery moves through a field, delivering site-specific rates based on GPS position and prescription maps or real-time sensor data.
What’s the difference between VRT and VRA?
VRT (variable rate technology) refers to the hardware and software systems enabling variable application. VRA (variable rate application) is the practice of actually applying inputs at different rates across a field using VRT equipment.
Is map-based or sensor-based VRT better?
Neither is universally better, they serve different purposes. Map-based VRT works well for seeding, lime, and base fertility using historical data. Sensor-based VRT excels for in-season nitrogen, where current crop status matters. Many advanced programs combine both approaches.
What equipment do I need to start?
Basic requirements include a VRT-capable controller, a GPS/GNSS receiver with adequate accuracy, rate-control hardware compatible with your applicator, and software to create and export prescription files.
What’s the fastest-payback VRT use case?
Variable-rate fertilizer on fields with significant soil variability typically delivers the fastest ROI. High input costs combined with clear yield-response differences across zones create measurable savings that justify equipment and setup costs quickly.
How do I prove ROI in my own fields?
Establish control strips or zones treated at uniform rates for direct comparison. Track input costs per zone, compare yields between VRT and uniform areas, and calculate net returns. Multi-year data strengthens the case by accounting for weather variability.