Join Us in Nashville: Meet Our Livestock Industry Experts At CattleCon 2026!
Book a Meeting >
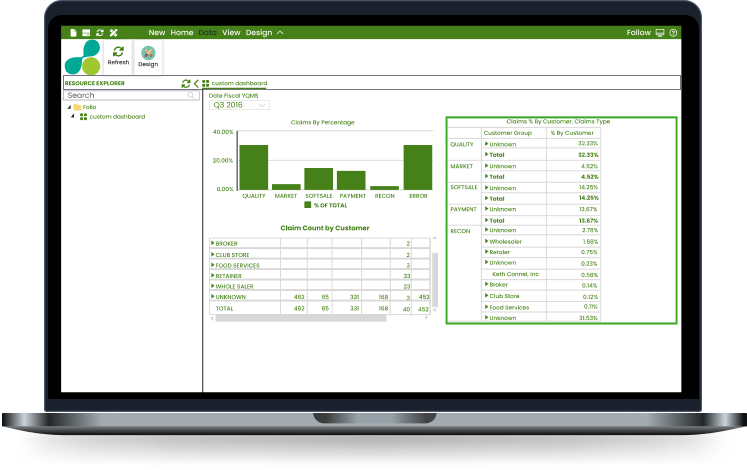
Power BI for Agriculture
Unify Your Ag Data on a Dynamic Power BI Dashboard!
Stop wasting time on disparate data & inaccurate forecasting. Get a Power BI agriculture analytics dashboard, built by seasoned data experts, to track KPIs across various aspects of your agribusiness efficiently.
Over 20 Years of Proven Compliance Solution Expertise
Leverage Agriculture Data Analytics For Exponential Growth
Increase operational efficiency and profitability of your business by automating data processing, analyzing trends, and identifying growth opportunities in the ever-evolving agriculture market.
To ensure the safe and timely delivery of meat products to consumers, an analytics dashboard enables meat packing and distribution businesses to:
Track animal weights and carcass yields to improve procurement and pricing.
Monitor production line efficiency and identify bottlenecks.
Visualize stock levels and forecast demand to avoid stock outs.
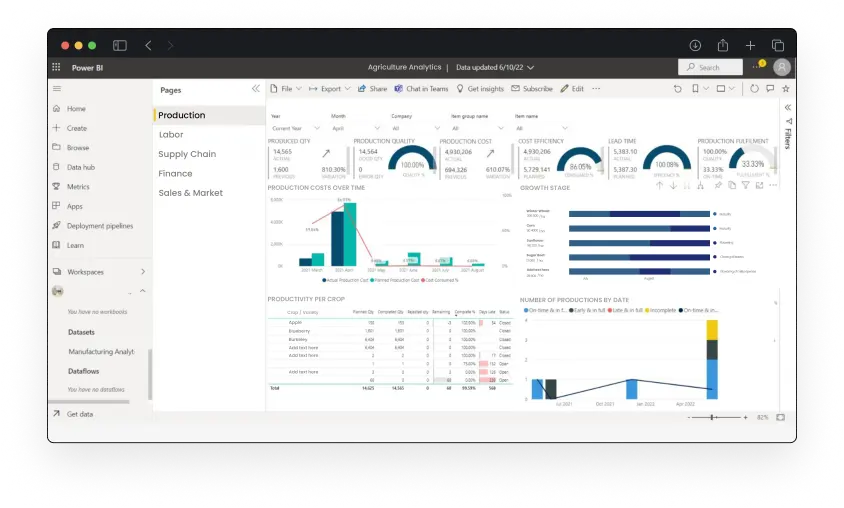
Visualize Daily Operations On a Power BI Platform Designed For Farmers & Ranchers
Livestock Producers
Know the total quantity of products produced within a specific period.
Analyze historical data to understand yield trends over the years.
Compare production levels across different regions.
Identify the most frequently produced products.
Monitor the stocking rate or the number of animals per unit area.
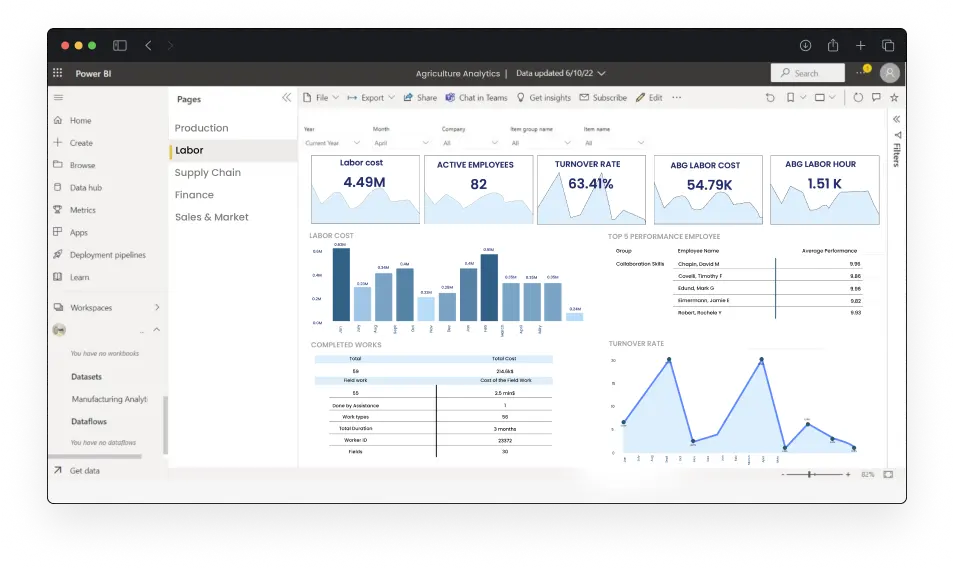
Turn Workforce Potential Into Tangible Results
Measure output per labor hour to gauge labor productivity.
Analyze labor costs as a percentage of total production costs.
Schedule labor efficiently based on production demands.
Monitor turnover rates to determine workforce stability.
Identify training needs based on performance data.
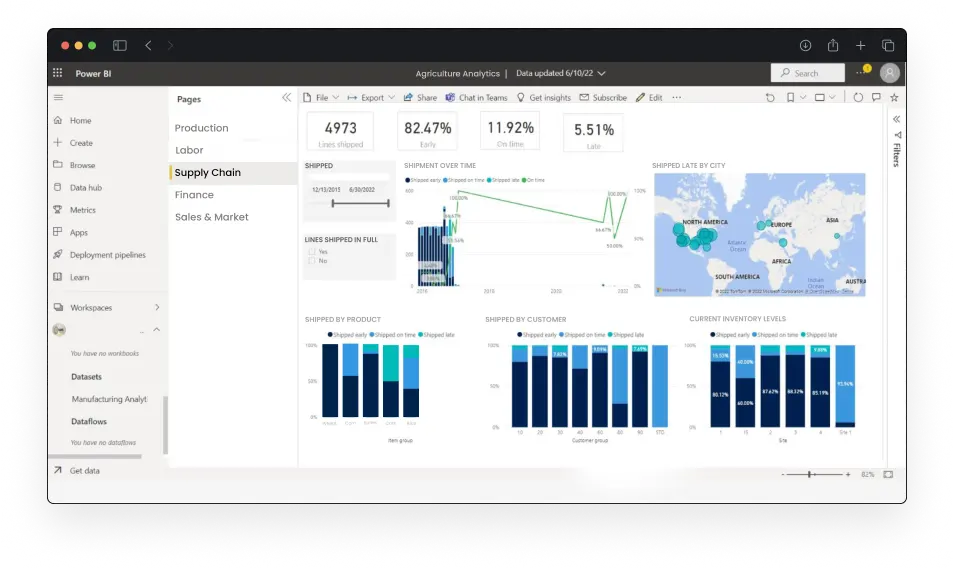
Optimize Your Flows to Outpace The Competition
Monitor inventory turnover rate or how quickly inventory is sold.
Forecast demand based on historical data to optimize inventory level.
Track transportation and logistics costs as a percentage of total sales value.
Get the order fulfillment rate by measuring the percentage of orders completed.
Know lead time by monitoring the time taken from order placement to delivery.
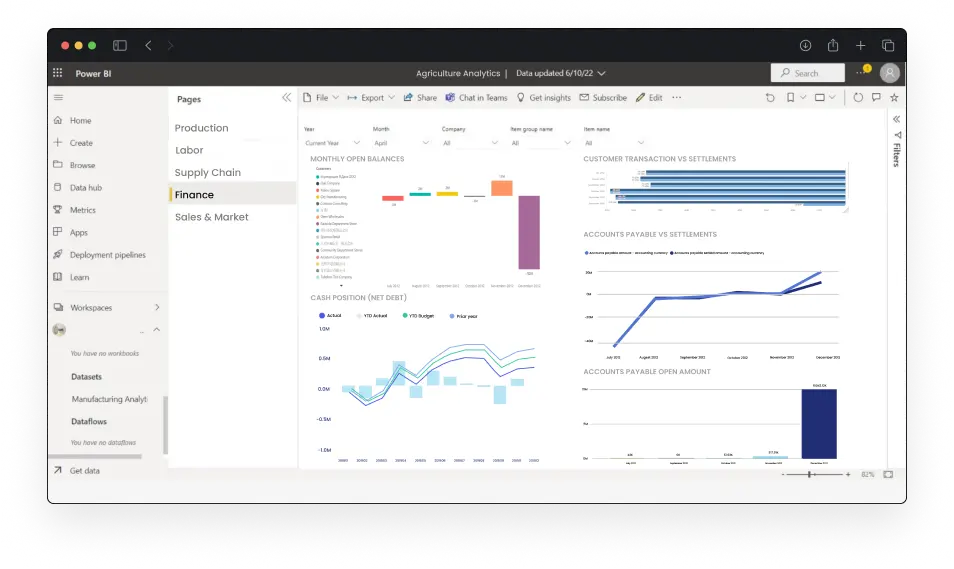
Set A Way For Sustained Financial Growth
Visualize key financial metrics such as revenue, expenses, and profit margins.
Analyze cash flow trends to ensure sufficient liquidity.
Evaluate profitability on a per-hectare basis for land efficiency.
Analyze costs associated with different product categories.
Compare actual financial performance against budgeted figures.
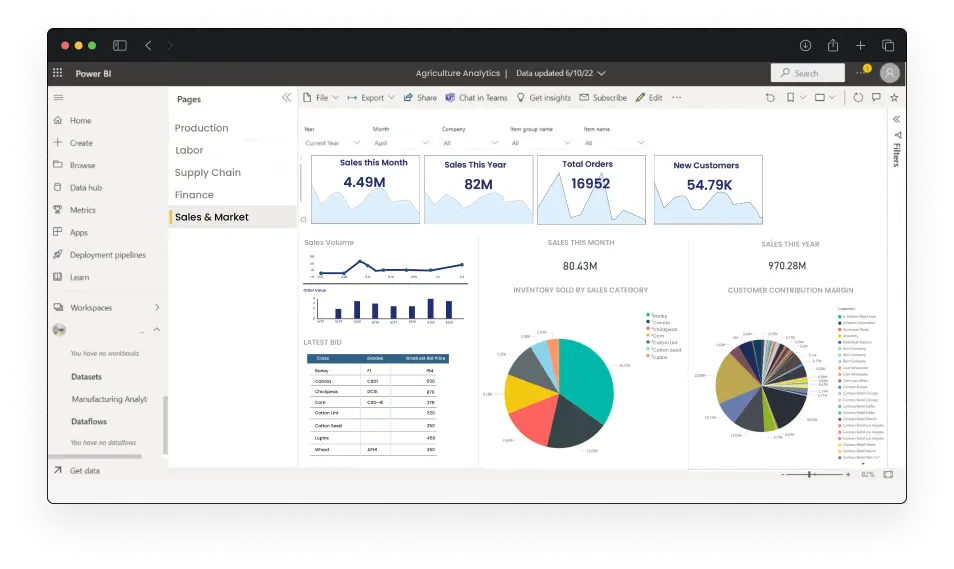
Take Your Business To New Markets For Greater Sales
Analyze year-over-year sales growth to assess market expansion.
Measure sales growth rates in each market.
Compare sales performance across different regions.
Evaluate product performance to identify top-selling items.
Track the costs associated with acquiring new customers.
Integrate PowerBi Dashboard With Multiple Apps & Break Down Data Silos
Why Entrust Folio3 With Your BI Needs?
We excel in building advanced data analytics and visualization platform for Ag businesses.
More than 20 years of experience in building BI solutions.
Custom-built solution according to your industry-specific needs.
24/7 support provided throughout the journey.
Proven track record of successful data analytics dashboard implementations.
More than 750 certified developers available to handle complex projects.
Microsoft Gold and Silver Partners
Adherence to ISO 27001 certified standards to ensure top-level data protection.
Clients that trust and value us enough to be our best spokespersons.
0+
Increased Operational Efficiency
0+
Our Advisors
Our esteemed advisory board brings unmatched expertise and a forward-thinking vision to driving growth and innovation for agriculture businesses, small and large.
Jerry Flint
Chief Operating Officer,
National Pork Board
Jerry brings a unique blend of pork industry expertise and strategic acumen to our team. His collaborative approach helps us bring impactful change in the livestock industry.
Renowned as the former President of ASTA and with deep-rooted expertise in seed technology, Jim's leadership fosters innovation, driving sustainable growth in the agriculture industry.
Harold's hands-on experience in agriculture helps us in our strategic direction. With his counsel, we innovate and nurture a thriving ecosystem of agricultural technology solutions.
Royce Rottinghaus
Senior Director of Sales &
Marketing,
UnCommon Farms
With a keen eye for market trends and a dedication to sustainable agriculture, Royce crafts initiatives that not only boost sales but also propel the industry toward a greener, more prosperous future.
He brings a wealth of experience optimizing swine health holistically. He has been previously associated with BI to develop ecosystems to serve customer needs for swine health management.
Enhancing Operational Efficiency of a Leading Agricultural Company With a BI Solution
A fully integrated comprehensive BI solution helped Growers Express overcome major data analytics challenges like manual data processing, lack of real-time insights, and limited data visualization and enabled the company to make data-driven decisions.
Business intelligence can benefit agriculture companies in several ways. It enables farmers to make informed decisions based on real-time data and use historical data to predict future trends that helps in production planning. Not only this, BI serves as a central hub for integrating various agricultural technologies, such as IoT devices, sensors, and drones and helps improve visibility into the agricultural supply chain.
How Can Data Analytics Be Used in Agriculture?When does California Prop 12 Take Effect?
Data analytics enables precision agriculture, where farmers use data from various sources such as soil sensors, satellite imagery, and weather forecasts to optimize farming practices. By analyzing this data, farmers can adjust their crop management strategies and predict crop yields.
What is the Benefit of Power BI Dashboard?
A Power BI dashboard provides real-time, interactive visualizations that help in tracking key metrics, making informed decisions, and integrating data from multiple sources. The dashboard can be easily shared with teams that promotes collaboration and ensures that everyone has access to the same insights.
How Do I Create an Automated Dashboard in Power BI?
For an automated Power BI dashboard tailored to the agriculture industry, consult with our experts at Folio3 AgTech. We'll guide you through data integration, transformation, modeling, and automated updates to deliver a customized, real-time unified solution for your agricultural insights.
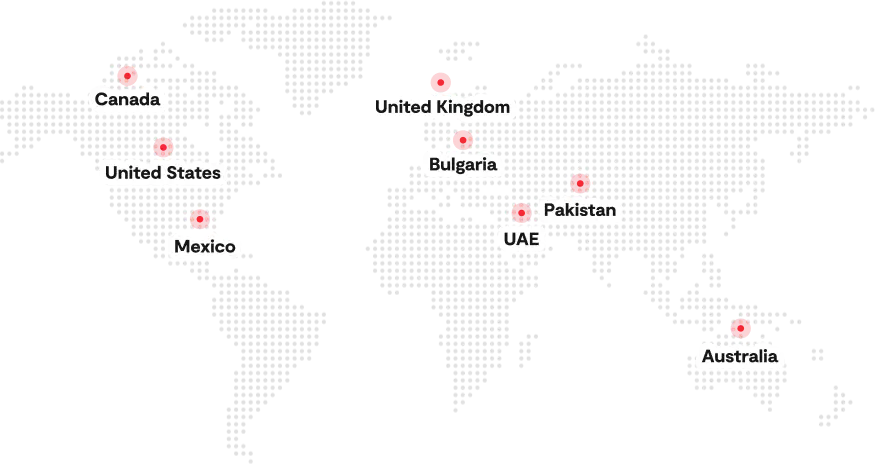
Serving the Agriculture Industry Globally Since 2004
Contact Us
Start Your Success Journey With Folio3 Today!
Get a Head Start with fast & scalable AgTech Solutions
Get a Free Consultation Within 24 Hours, with a No-Obligation Ballpark Estimate
Error: Contact form not found.
Our Expertise
20+ years in the AgTech Industry
600+ projects completed worldwide
A quality management system compliant with ISO 9001, ISO 27001 & 27701