
With record-setting cattle prices and volatile input costs dominating the 2025–2026 market cycle, every dollar left on the table in your feedlot is a dollar you can’t afford to lose. The hard truth? Feed alone accounts for roughly 75% of operating costs on most cow-calf and feedlot operations. That makes your feeding program the single biggest lever for profitability.
But here’s where many feedlot managers get tripped up: “efficiency” isn’t just about cattle eating less. True feedlot performance comes from Feed Conversion Ratio (FCR) and Average Daily Gain (ADG) working in tandem.
One without the other is like running a truck with a tuned engine on half a tank; you’ll run well, just not far enough. This guide breaks down the proven pillars to help you systematically close the gap between where your cattle are performing and where they should be.
Feedlot Efficiency vs. Performance: Why You Need Both
Before investing in new technology or switching ratios, you need a clear-eyed view of what you’re actually measuring. Two feedlot managers can both claim “great performance” and mean completely different things. Let’s get the metrics straight.
Performance: The Engine
Performance metrics tell you how fast your cattle are growing. Average Daily Gain (ADG) measures pounds gained per day on feed, while final carcass weight determines the actual value of the animal at harvest. Strong ADG, typically 3.5 to 4+ lbs/day in modern finishing programs, is essential, but it’s only half the equation.
Efficiency: The Fuel Economy
Efficiency metrics answer a tougher question: how much did that gain cost you? Feed Conversion Ratio (FCR), expressed as pounds of feed per pound of gain, is the standard benchmark. Anything under 6:1 in a finishing yard is solid.
Then there’s Residual Feed Intake (RFI), a genetic metric that identifies cattle consuming significantly less feed than expected for their body weight and gain. Low-RFI cattle can eat up to 15–20% less than their high-RFI pen mates while putting on the same pounds. It’s an invisible efficiency edge that compounds over a 150-day feeding period.
When Pushing for Max Gain Hurts Efficiency
Here’s the counterintuitive part: chasing maximum ADG at all costs can actually tank your net return. Rapidly increasing energy density to push gains can trigger metabolic waste, subacute acidosis, and liver abscesses, all of which eat into carcass value and feed conversion. The sweet spot lies in optimizing both metrics together. The table below illustrates the difference.
| Metric | High ADG / Poor FCR | Moderate ADG / Strong FCR | Net Return Impact |
| ADG (lbs/day) | 4.2 | 3.7 | — |
| FCR (Feed:Gain) | 7.2:1 | 5.8:1 | — |
| Feed Cost/Head (est.) | $780 | $650 | +$130 saved |
| Health Pulls (%) | 8% | 4% | Lower vet costs |
| Est. Net Return/Head | $45 | $115 | +$70/head |
Key Takeaway: A moderate-gain, high-efficiency program often generates a stronger net margin than a pedal-to-the-metal approach. Understanding this dynamic is the foundation for everything that follows.
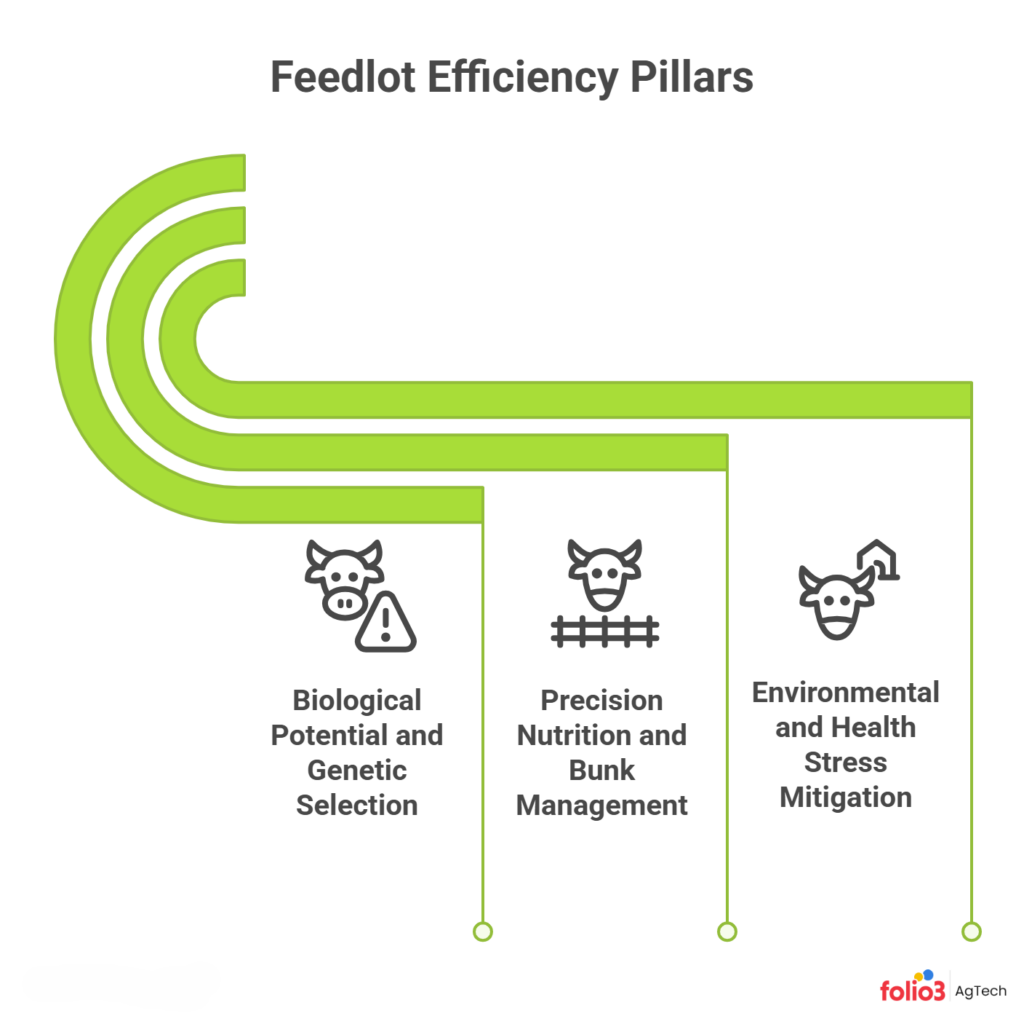
Pillar 1: Biological Potential and Genetic Selection
Your feedlot’s profit ceiling is set before a single calf steps off the trailer. Genetics is the blueprint, and the most impactful genetic trait for feedlot efficiency that most managers still underweight is Residual Feed Intake.
Selecting for Residual Feed Intake (RFI)
Low-RFI cattle are biologically wired to convert feed more efficiently. They generate less metabolic heat, have lower protein turnover rates, and exhibit calmer feeding behavior, all of which add up. When you’re sourcing feeder cattle, ask about RFI data from the sire’s progeny test. If that data isn’t available, look for sire EPDs (Expected Progeny Differences) that capture feed efficiency traits.
The “Pre-Arrival” Factor
What happened to that calf in utero and during its first 90 days of life significantly dictates feedlot performance. Maternal nutrition during late gestation programs fetal muscle development; underfed cows produce calves with fewer muscle fibers and lower lifetime gain potential. That’s why buying the cheapest, lightest calves at the sale barn often backfires. You’re buying their mother’s nutrition program, too.
High-Priority Genetic Traits for the Finishing Phase
When evaluating genetics for terminal performance, prioritize:
- Low RFI scores for feed efficiency
- Strong ADG EPDs for growth rate
- Marbling and carcass weight EPDs to capture grid premiums
- Docility scores, temperamental cattle underperform by 10–15% on ADG
- Beef-on-dairy potential, as crossbred calves from dairy dams are an expanding source of consistent feeder cattle
Pillar 2: Precision Nutrition and Bunk Management
You can’t gene-select your way out of a poor feeding program. Nutrition is where daily dollars are won or lost, and the difference between a top-tier operation and an average one often comes down to how well the feed truck is managed.
Bunk Calling 101
The old approach of keeping bunks full (“ad libitum”) sounds generous, but it leads to feed spoilage, inconsistent intake, and sorting. Progressive feedlots have shifted to “slick bunk” management, targeting bunks that are nearly empty at the next feeding.
It doesn’t mean starving cattle; it means reading bunk scores daily and adjusting call weights by 1–2% based on consumption patterns. Done right, you reduce waste while maintaining consistent dry matter intake (DMI).
Feed Processing
If your grain processing system is the bottleneck, you’re burning money. Research found that steam-flaked corn achieves a total starch digestibility of approximately 99%, compared to 91% for dry-rolled corn. That translates to meaningful improvements in feed efficiency, since more starch is fermented in the rumen, where the animal can extract the most energy from it.
Steam-flaked corn has also been associated with roughly 10–15% better ADG compared to dry-rolled alternatives. It’s an upfront capital investment, but for larger operations, the payback on a steam-flaker can be measured in months, not years.
Additives and Ionophores
Monensin (Rumensin®) remains one of the highest-ROI feed additives available. It shifts rumen fermentation toward propionate production, improving energy capture by 3–5% while also providing a measure of coccidiosis control.
When combined with a properly timed growth implant strategy, the energy that would have been deposited as excess fat is redirected toward lean muscle accretion. Use automated cattle feeding software to track additive inclusion rates at the pen level and ensure consistency load after load.
Water Quality
Water drives dry matter intake, period. Cattle typically consume 1.5 to 2 gallons of water per pound of dry feed consumed. If your water troughs are dirty, flow rates are low, or water is high in sulfates or nitrates, intake drops, and so does performance. Test your water twice a year and invest in trough cleaning; it’s one of the cheapest performance improvements you can make.
Pillar 3: Environmental and Health Stress Mitigation
You can have world-class genetics and a perfectly balanced ration, and still lose money if your cattle are stressed. Think of every animal as carrying a “stress cup.” Each stressor, like shipping, commingling, weather, mud, and disease exposure, fills that cup a little more. When it overflows, you get pulled cattle, chronic disease, and death loss.
The “Stress Cup” Concept in Practice
Bovine Respiratory Disease (BRD) remains the most expensive health challenge in the feedlot sector. It accounts for approximately 75% of all feedlot morbidity and 50–70% of all finishing mortality, costing the U.S. beef industry an estimated $800 to $900 million annually. Nearly 91% of BRD cases are diagnosed within the first 27 days after arrival, which tells you this is fundamentally a receiving-period problem. Managing the stress cup during those first four weeks is everything.
Mud and Bedding
Mud doesn’t just make your feedlot look bad; it actively steals gain. Muddy conditions can increase energy requirements by approximately 10%. When cattle are standing in 4–8 inches of mud, ADG can decrease by nearly 15%. At belly-deep mud levels, gain can drop by 25%, and cost-of-gain can spike by up to 56%.
Proper pen drainage with a 2–5% slope, mounds providing 25 sq. ft. per head, and timely scraping after storms are non-negotiable management practices. Tracking pen conditions digitally through feedlot management software helps you act before the damage is done.
Preconditioning
Buying unvaccinated, commingled, high-risk calves at a lower price per pound is a tempting strategy until the vet bills and death loss hit. Low-risk cattle (single-source, vaccinated, weaned 45+ days) start with a nearly empty stress cup. They eat sooner, pull less, and finish faster. When you factor in treatment costs, reduced ADG, and lower carcass quality, that initial “discount” often evaporates entirely. USDA NAHMS data estimates that about 16% of feedlot cattle in large operations are affected by BRD, costing $23.60 per case in direct treatment alone.
Implant Strategy
Growth implants remain one of the most effective tools for improving feedlot efficiency, but frequent reimplanting means frequent trips through the chute. Long-duration implant protocols (covering 150–200+ days) reduce handling events from 2–3 down to 1.
They cut stress and labor while maintaining hormonal support for lean growth. Work with your veterinarian to design a protocol that aligns with your cattle type and days-on-feed targets. A well-managed cattle health and treatment tracking system can log implant dates and schedule reimplant windows automatically.
Using AgTech to Track the “Invisible Losses”
If your feedlot still manages inventory on a whiteboard and reconciles closeouts from paper feed tickets, you’re flying blind, and it’s costing you more than you think. The industry average for inventory shrinkage is a persistent problem that compounds over time. Modern feedlot management eliminates the guesswork.
Real-Time Dry Matter Intake Tracking
When DMI data flows directly from the feed truck scale to your management platform, you can spot problems the moment they start. A pen that drops 5% in intake on a Tuesday doesn’t wait until Friday’s bunk review to get flagged. With software that integrates feed conversion ratio tracking, nutrition, and inventory data, you move from “post-mortem” accounting to “real-time” management.
From Reactive to Predictive Management
The real power of digital feedlot systems is predictive analytics. When you combine historical close-out data, real-time intake patterns, weather forecasts, and pen-level health records, the software can flag high-risk pens before they break. It is the shift from treating sick cattle to preventing sickness, and from managing losses to maximizing returns. If you’re still working with spreadsheets, you’re competing against operators who aren’t.
Summary Checklist: Your 10-Step Feedlot Audit
Use this as a walk-through checklist the next time you evaluate your operation:
- Bunk Space: Minimum 18 inches per head for new arrivals; 12 inches for adapted cattle.
- Water Flow: 1 inch of linear water space per head. Test water quality biannually.
- Bunk Scores: Are you calling bunks daily? Target clean or slick bunks before the next feeding.
- RFI / Genetic Data: Are you sourcing cattle with known feed-efficiency genetics?
- Grain Processing: Evaluate starch digestibility. Consider fecal starch testing.
- Implant Timing: Is your implant protocol reducing chute events while maximizing growth?
- Mud Depth: Walk pens after rain. Scrape when mud exceeds 4 inches.
- Receiving Protocol: Are high-risk cattle identified and managed separately on arrival?
- Pen Space: Finishing cattle need 250+ sq. ft. per head in open lots.
- Data Systems: Is feed, health, and inventory data captured digitally in real time?
The Future of Feedlots Is in the 1% Gains
There is no single silver bullet for feedlot profitability. The operations that consistently outperform their peers aren’t doing one big thing differently; they’re doing a hundred small things 1% better. These marginal gains compound across thousands of heads and hundreds of feeding days.
The tools exist to manage every one of these variables today. Whether you’re a 500-head backgrounding yard or a 50,000-head commercial feedlot, the principles are the same: measure relentlessly, manage proactively, and never stop auditing your own operation. If you’re ready to see where your “invisible losses” are hiding, explore what Folio3’s feedlot management platform can do for your operation or reach out for a one-on-one consulting audit.
FAQs
What Is a Good Feed Conversion Ratio for Feedlot Cattle?
A strong FCR for finishing cattle typically falls between 5.5:1 and 6.5:1, meaning 5.5 to 6.5 pounds of feed per pound of gain. However, the “best” FCR depends on your cattle type, ration energy density, and environmental conditions. Focus on improving your own baseline rather than chasing a universal number.
How Often Should Feedlot Pens Be Scraped to Maintain Efficiency?
Pens should be scraped after every significant rain or snowmelt event, and routinely on a weekly or bi-weekly basis during wet seasons. Removing mud before it exceeds 4 inches can prevent a 15% drop in daily gain and keep your cost-of-gain from spiraling upward.
Can Small Feedlots Benefit From Feedlot Management Software?
Absolutely. Digital tools scale to any operation size. Even a 200-head yard can see meaningful improvements in inventory accuracy, feed tracking, and health record management. The labor savings and error reduction often pay for the software within the first feeding cycle.
What Is the Biggest Mistake New Feedlot Managers Make With Nutrition?
Overfeeding energy too early in the receiving period. Freshly arrived cattle need time for their rumen to adapt to a high-grain diet. Aggressive step-ups cause acidosis, reduce intake, and set the stage for liver abscesses. A well-designed transition program over 21–28 days protects both health and long-term efficiency.
How Does Weather Affect Feedlot Feed Efficiency?
Cold stress below an animal’s lower critical temperature increases maintenance energy by approximately 1% per degree Fahrenheit below that threshold. Heat stress reduces intake. Both scenarios reduce the proportion of energy available for gain. Windbreaks, shade structures, bedding, and proactive ration adjustments during extreme weather events are critical.