

As one of the most essential parts of the overall global structure, the food and beverages (F&B) sector is in charge of serving consumers with safe, high-quality food and satisfying their needs.
In this environment, companies use the KPI metrics within the food industry to indicate their results and the process of moving toward their goals and objectives. KPIs are the most significant indicators through which businesses may measure the performance of their operations, from production efficiency to customer satisfaction.
By adopting key performance indicators for the food industry, companies can identify areas for improvement, evaluate strongholds, and make decisions that equip the organization for competitiveness and growth.
Tracking the KPI components will become more paramount when incorporating food safety compliance software. Given that regulatory norms and client appreciation clearly trend toward an increase.
F&B businesses need market-leading advanced technologies to maintain world-class food safety standards, process flowlines, and risk prevention. This comprehensive guide explores the best key performance indicators for food industry, how these KPIs align with organizational goals, and how they contribute to sustained success in an increasingly competitive market.
Understanding Food Safety Compliance
Food safety compliance reflects a relationship between food products and the government, where the government establishes various requirements for food products to ensure their safety for consumers.
The term is associated with protecting against microbiological food contamination and bacteria inhabiting food during the production, processing, and distribution stages. Respecting the industry, preserving public health, and earning consumer confidence all depend heavily on compliance with food safety laws.
Governmental organizations like the USDA and FDA, as well as international groups like the Codex Alimentarius Commission, have regulations and standards that the food business and food manufacturers must follow.
They involve hygiene, sanitation, labeling, packaging of products, and product testing to guarantee the safety and quality of food products. These standards are binding principles that all food-related businesses must uphold to operate legally and stay sustainable.
Nevertheless, when it comes to accessing food safety compliance, food safety compliance software stands for applications and systems based on technology that performs the work of the compliance process by simplifying it in the food industry.
Such software systems provide various services, including automatic real-time record keeping, real-time record checking documents, and control over critical controls. Using the software for food safety compliance will enable businesses to improve their compliance efforts’ efficiency, accuracy, and transparency and reduce the risks of non-compliance fines, product recalls, and reputation damage as consequences.
Understanding Key Performance Indicators (KPIs)
The key performance indicators for the food industry, on the other hand, are quantitative measures that influence organizations to move toward their goals and achievements. They define a company’s efficiency progress in its operations and affairs.
Key performance indicators for food industry are of the utmost importance for decision-making. They aid in tracking performance, recognizing areas for improvement, and enabling the business to make strategic adjustments based on informed decisions.
Recognition and application of key performance indicators in food industry are essential steps for successful and profitable firm development in this environment, which constantly experiences the most challenging competition and has the narrowest profit margins.
Through monitoring and calculations, the companies evaluate their level of achievement against their industries, set reachable high targets, and never stop perfecting.
Types of KPIs Relevant to the Food Industry:
Financial KPIs
Financial metrics are vital for assessing a food business’s economic health and viability. Examples include:
- Revenue: Total income generated from sales of food products or services.
- Profit Margins: Percentage of revenue retained as profit after deducting expenses.
- Cost per Unit: Average cost incurred to produce one unit of food product, including materials and labor.
Operational KPIs
These metrics focus on the efficiency and productivity of production processes and supply chain management. Relevant key performance indicators for food industry may include:
- Production Efficiency: The apparent output/input ratio of the food production process goes down.
- Inventory Turnover: The pace at which sales and stock are made within a specific time.
Quality and Compliance KPIs
Food safety and meeting high regulatory standards where appropriate are indispensable in the food industry. KPIs in this category include:
- Food Safety Metrics: A company that adheres to food safety standards and regulations, such as HACCP (Hazard Analysis Critical Control Point).
- Regulatory Compliance: Conformity to food safety regulations and labeling rules for local, state, and global food.
Customer Satisfaction KPIs
Customers’ loyalty and engagement are vital to a business’s growth and survival in the food trade. Relevant KPIs may include:
- Customer Retention Rate: Number of customers who re-ordered over a certain period of time.
- Net Promoter Score (NPS): This is a measure of customer loyalty and satisfaction based on the probabilistic chance that customers will recommend the business to others.
Sustainability KPIs
Through enlarged environmental awareness, sustainability metrics are gaining more significance for the food business. Examples include:
- Waste Reduction: Reduction in food waste produced along the whole chain from production to distribution.
- Carbon Footprint: Greenhouse gas emissions are accounted for and measured through the process of Food production and distribution measurement.
Importance of KPIs in the Food Industry
KPIs play integral roles in steering the food industry’s success and sustainability. They assist in improving decision-making and identifying areas for improvement. They also help ensure compliance, meet customer expectations, and support sustainability projects.
KPIs, such as those used in the strategic management of food businesses, can be implemented to help firms survive in a competitive and dynamic market while emphasizing fair conduct and catering to the needs of various stakeholders.
Enhancing Decision-Making Processes:
Organizational goals can be gauged in a tactical form as KPIs provide objective, data-driven insights that enable informed decision-making at various levels of a food business.
Monitoring key indicators will give stakeholders a clear view of trends, patterns, and areas of concern, enabling critical interventions and strategic realignments.
Identifying Areas for Improvement and Optimization:
KPIs act as performance benchmarks, helping food businesses pinpoint inefficiencies, bottlenecks, and areas ripe for improvement.
Through continuous monitoring and analysis, companies can streamline processes, reduce waste, and optimize resource allocation to enhance efficiency and productivity.
Ensuring Food Safety and Compliance with Regulations:
Food safety and regulatory compliance KPIs are critical for safeguarding public health and maintaining legal adherence.
Monitoring metrics such as compliance with food safety standards and regulations and tracking incidents of non-compliance enables prompt corrective actions and ensures adherence to industry best practices.
Meeting Customer Expectations and Improving Satisfaction:
Customer-centric KPIs allow food businesses to gauge satisfaction levels, identify areas for improvement, and tailor products and services to meet evolving consumer preferences.
By tracking metrics like customer retention rates, Net Promoter Score (NPS), and feedback, companies can prioritize initiatives that enhance the overall customer experience and foster loyalty.
Supporting Sustainability Initiatives and Responsible Practices:
KPIs focused on sustainability play a crucial role in promoting environmentally responsible practices within the food industry.
Metrics such as waste reduction, carbon footprint, and sustainable sourcing help businesses monitor and reduce their environmental impact, aligning with growing consumer demand for eco-friendly products and practices.
Best Key Performance Indicators for Food Industry
Financial KPIs:
Gross Profit Margin:
Definition: The percentage of revenue retained after deducting the cost of goods sold (COGS).
Importance: Indicates the efficiency of production and pricing strategies in generating profits.
Calculation: (Revenue – COGS) / Revenue * 100
Example: A high gross profit margin suggests effective cost management and pricing strategies, while a declining margin may indicate inefficiencies in production or pricing.
Cost of Goods Sold (COGS):
Definition: The direct costs incurred in producing goods, including raw materials, labor, and manufacturing overhead.
Importance: Reflects the expenses directly associated with production activities.
Calculation: Total production costs, excluding indirect expenses
Example: Monitoring COGS helps identify cost-saving opportunities and assess the impact of changes in input prices or production processes on profitability.
Return on Investment (ROI):
Definition: Measures the profitability of investments relative to their cost.
Importance: Assesses the efficiency of capital allocation and investment decisions.
Calculation: (Net Profit / Investment Cost) * 100
Example: A high ROI indicates that investments in equipment, technology, or expansion are yielding favorable returns, while a low ROI may signal the need for reevaluation or resource reallocation.
Operational KPIs:
Production Yield:
Definition: Measures the percentage of usable output relative to the total input during production.
Importance: Indicates production efficiency and identifies opportunities to minimize waste.
Calculation: (Good Units Produced / Total Units Started) * 100
Example: Improving production yield reduces material waste and enhances resource utilization, leading to cost savings and increased profitability.
Inventory Turnover Ratio:
Definition: Measures how quickly inventory is sold and replaced within a specific period.
Importance: Reflects inventory management efficiency and cash flow optimization.
Calculation: Cost of Goods Sold / Average Inventory
Example: A low ratio would point to overstocking or slowly moving inventory, which would need needless capital commitment, whereas a high turnover ratio would show good inventory management techniques.
Production Downtime:
Definition: Measures the amount of time production activities are halted due to unplanned interruptions or maintenance.
Importance: Reflects equipment reliability and operational efficiency.
Calculation: Total Downtime / Total Production Time * 100
Example: Minimizing production downtime maximizes output capacity and ensures timely delivery of products, enhancing customer satisfaction and profitability.
Quality and Compliance KPIs:
Food Safety Index:
Definition: Evaluates adherence to food safety protocols and regulations.
Importance: Ensures consumer protection and minimizes the risk of foodborne illnesses or contamination incidents.
Calculation: Composite score based on compliance with food safety standards and inspection results.
Example: A high food safety index indicates robust quality control measures and compliance with regulatory requirements, instilling trust and confidence in consumers.
Compliance with Regulatory Standards:
Definition: Measures the degree to which a company complies with food safety, labeling, and other regulatory requirements.
Importance: Mitigate legal and reputational risks associated with non-compliance.
Calculation: Percentage of regulatory standards met or violations recorded.
Example: Maintaining high compliance levels ensures legal compliance and minimizes the likelihood of fines, penalties, or product recalls.
Product Quality Metrics (e.g., defects per million units):
Definition: Quantifies the frequency and severity of product defects or deviations from quality standards.
Importance: Reflects product consistency and customer satisfaction levels.
Calculation: Number of defects or deviations divided by total units produced, multiplied by one million.
Example: Monitoring product quality metrics helps identify defects’ root causes and implement corrective actions to improve quality and reduce waste.
Customer Satisfaction KPIs:
Customer Retention Rate:
Definition: Measures the percentage of customers retained over a specific period.
Importance: Indicates customer loyalty and the effectiveness of customer retention strategies.
Calculation: ((Number of Customers at End of Period – Number of New Customers) / Number of Customers at Start of Period) * 100
Example: A high retention rate suggests satisfied and loyal customers, which reduces acquisition costs and increases lifetime customer value.
Net Promoter Score (NPS):
Definition: Measures customer loyalty and likelihood to recommend the company to others.
Importance: Provides insights into customer perceptions and brand advocacy.
Calculation: Percentage of Promoters (Customers Likely to Recommend) – Percentage of Detractors (Customers Unlikely to Recommend)
Example: A positive NPS indicates strong customer advocacy and satisfaction, while a negative score signals areas for improvement and potential risks to customer loyalty.
Customer Complaint Resolution Time:
Definition: Measures the average time taken to resolve customer complaints or issues.
Importance: Reflects responsiveness to customer concerns and service quality.
Calculation: Total Time Spent Resolving Complaints / Number of Complaints
Example: Prompt resolution of customer complaints improves satisfaction levels and prevents negative word-of-mouth, enhancing brand reputation and loyalty.
Sustainability KPIs:
Waste Reduction Rate:
Definition: Measures the percentage reduction in waste generated during production or operations.
Importance: Demonstrates commitment to environmental sustainability and resource efficiency.
Calculation: (Total Waste Generated – Total Waste Reduced) / Total Waste Generated * 100
Example: Implementing waste reduction initiatives minimizes environmental impact and operational costs, contributing to long-term sustainability goals.
Energy Efficiency Metrics:
Definition: Quantifies energy consumption and efficiency in production processes.
Importance: Reduces environmental footprint and operational costs associated with energy usage.
Calculation: Energy Consumption per Unit of Output or Production Volume
Example: Improving energy efficiency reduces greenhouse gas emissions and energy expenses, enhancing both environmental and financial sustainability.
Sustainable Sourcing Index:
Definition: Measures the percentage of raw materials sourced sustainably or ethically.
Importance: Promotes responsible sourcing practices and supports supply chain transparency.
Calculation: Percentage of Raw Materials Sourced from Certified Sustainable Sources
Example: Increasing the sustainable sourcing index ensures ethical procurement practices and aligns with consumer preferences for environmentally and socially responsible products.
How to Implement and Measure KPIs Effectively?
Following the below strategies, businesses can implement and measure key performance indicators for food industry effectively, driving continuous improvement, informed decision-making, and sustainable growth:
Setting SMART Objectives for Each KPI
Specific: Well-defined KPIs should state that they measure a precise metric and serve a clear purpose. For instance, instead of a general meeting goal like “boost production,” specify a measurable target like “increase production output by 10% within six months.”
Measurable: Ensure that each KPI is stipulated in a quantifiable manner and measurable in time. Set up clear indicators and thresholds to enable an accurate tracking and evaluation of success and efforts.
Achievable: Establish realistic and achievable targets for success, taking into consideration the resources from your environment, skills, and market conditions. Unrealistic goals can bring about discouragement and hamper progress among the staff itself.
Relevant: Link KPIs with organizational aims and strategic objectives. Concentrate on KPIs that drive the business towards its goals. Your product’s development needs to tackle the market potential.
Time-bound: Set a date frame and the time of attainment of KPI goals. When goals are set in a time-contingent setting, there is a perception of a time crunch. Consequently, activities will be given the necessary attention to achieve the objectives within specific timelines.
Using Technology and Data Analytics for Tracking and Monitoring KPIs in Real-Time:
Utilize Advanced Software Solutions: Be sure to spend time on effective data analysis and business intelligence tools to collect, monitor, and visualize KPI data in real-time. With these technologies, it is easy to understand performance behavioral patterns, unexpected events, and areas for improvement.
Implement Automation: To a considerable extent, automate the data acquisition and reporting techniques. Automated systems can systematize data collection across various sources, centralize all the information, and generate detailed and customizable reports. As a result, less time will be spent on data gathering and entry errors.
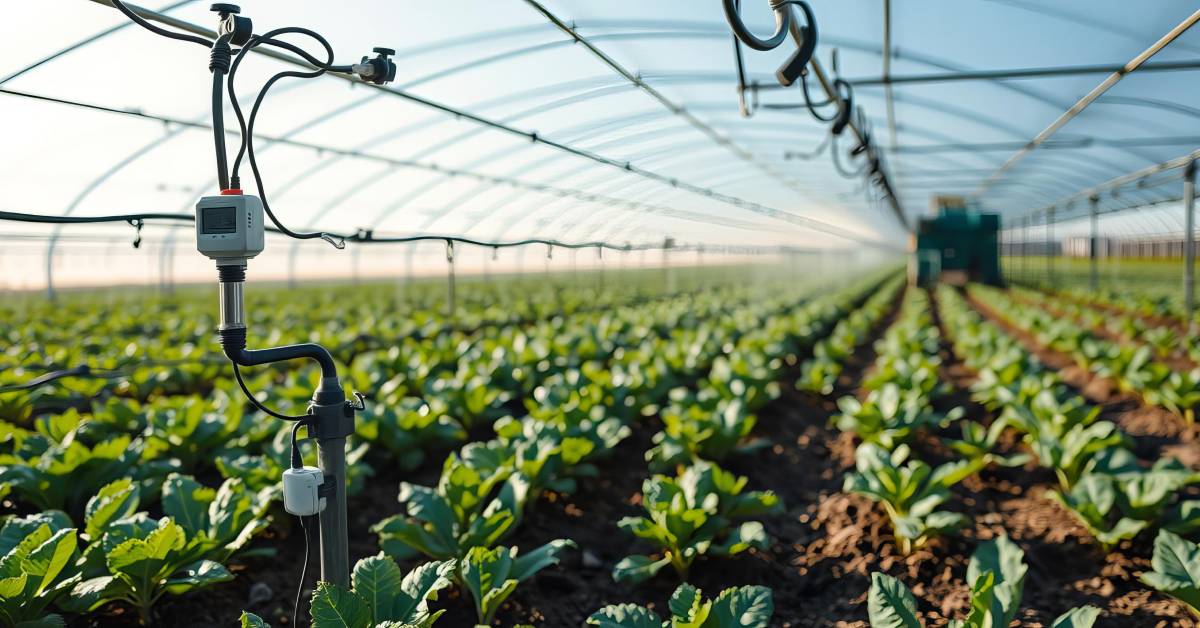
Utilize IoT Sensors and Devices: Provide Internet of Things (IoT) sensors and gadgets to measure the leading metrics of production, supply chain, and quality-checking processes. IoT technology allows for monitoring critical elements in real-time, and decisions may be made proactively.
Conducting Regular Assessments and Reviews to Evaluate KPI Performance:
Schedule Periodic Reviews: Have a timeline for checking the KPI performance review, for instance, on a monthly, quarterly, or annual basis. Frequent check-ups help participants compare results, investigate the course of things, and correct the deviations aspirated from the KPIs in due time.
Engage Key Stakeholders: Participants, executives, department heads, and working-level employees should attend KPI reviews and participate in the discussions. Collaborative appraisals increase responsibility and transparency while upholding the organization’s values and goals.
Identify Root Causes: Investigate both positive and negative underlying factors of KPI performance, identify the reasons for their occurrence, and identify actions that can be taken to prevent these factors. Determining determinants of achievement is the basis for implementing focused strategies, including positive remedies.
Making Data-Driven Decisions Based on KPI Insights:
Interpret Data Effectively: Consideration of factors like the market dynamics, the operational constraints, and the external influences is important when interpreting the metric data. Look for the relations, patterns, and outliers to explain and apply them in the decision-making process.
Link KPIs to Business Objectives: Link the key performance indicators for the food industry assessment with the larger company objectives and strategies. Humanize the given sentence. Use KPI data to inform a strategic plan, resource allocation, and operational center, keeping it on target with organizational objectives.
Empower Decision-Makers: Provide decision-makers with timely and relevant KPIs, as well as tools and skills to evaluate these indicators correctly and take the proper actions. Include initiatives to promote a culture that uses data and emphasizes evidence-based decision-making across all organizational levels.
Continuous Improvement and Adjustment of KPIs as Needed:
Monitor KPI Relevance: Frequently check for the applicability of current key performance indicators for food industry in establishing those results, which will, in turn, motivate workers to perform. Ensure the KPIs are refreshed or updated to match the company’s objectives as they evolve into new priorities or strategies.
Stay Agile: Remember that everything is subject to change (marketing conditions, technology, stakeholders’ feedback) and be able to act on these changes immediately. Synchronize KPIs and performance indicators with the changes by making sure they continue to be important and actionable.
Encourage Innovation: Foster a culture of innovation and experimentation to explore new approaches for measuring and improving performance. Encourage employees to propose innovative KPIs and performance indicators that align with organizational goals and values.
Conclusion
Key performance indicators for food industry are indispensable tools for driving success and sustainability. By aligning KPIs with strategic objectives, leveraging data-driven insights, and fostering a culture of continuous improvement, businesses can enhance operational excellence, meet customer expectations, and achieve long-term profitability.
Food businesses must remain adaptable and responsive to evolving industry trends and challenges, embracing innovation and continuous learning to stay competitive in a dynamic industry.
By effectively leveraging key performance indicators for food industry and adopting a mindset of constant improvement, food businesses can navigate challenges, seize opportunities, and drive sustainable growth in the ever-changing food industry.
FAQs
What is a Key Performance Indicator in the Food Industry?
Key performance indicators for food industry are vital metrics used to gauge effectiveness in food production. In the food industry, KPIs encompass various aspects, such as production efficiency and product quality. Production efficiency KPIs may include measures like throughput, downtime, and cycle time.
What are the KPIs for Food Product Development?
For food product development, common KPIs include sales volume and value, market share and penetration, customer satisfaction and loyalty, brand awareness and recognition, and cost efficiency and profitability.
What is a KPI in F&B?
In the Food and Beverage (F&B) industry, key performance indicators for food industry play a crucial role in optimizing management practices, reducing waste, increasing revenue, and enhancing customer satisfaction.
Effective F&B KPIs may include metrics related to demand forecasting, inventory accuracy, sales performance, and customer feedback.
What are the KPIs for Food Safety and Quality?
To ensure food safety and quality, it’s essential to identify and monitor key performance indicators for food industry. These may include metrics such as the number of foodborne illness incidents, compliance with sanitation standards, successful completion of food safety training, and adherence to regulatory requirements.